Thread Related Memory Leaks in Spring Boot

P
I'm a software engineer interested in Cloud technologies and web applications.
Search for a command to run...
I'm a software engineer interested in Cloud technologies and web applications.
No comments yet. Be the first to comment.
A lot of the documentation can be found here on Spring's website about the threat. The most important part is the second paragraph. Spring Boot users are only affected by this vulnerability if they have switched the default logging system to Log4J2....

AWS CDK Pro Tips

Query a Postgres database using a Lambda in 5 minutes!

Beware Implicitly 'any'!

Learn about the benefits of serverless

I am going to walk through how I found a thread related memory leak which was caused by incorrect thread usage. I also created a Github repo demonstrating how you can produce a memory leak and profile it by using Visual VM.
Typically, you don't want to spin up new thread pools every time a client makes a request. You want to constrain this type of component so that you have control over memory utilization. Therefore, pro tip: make sure thread pools are managed at a high-level component and not driven by lower-level components.
You can identify memory leaks by profiling your application. Most typical applications have memory spikes that go up and down at reasonable levels. If your applications memory utilization does not seem to drop until it's maxed out you may have a problem. If your application is crashing when memory spikes you have a big problem.
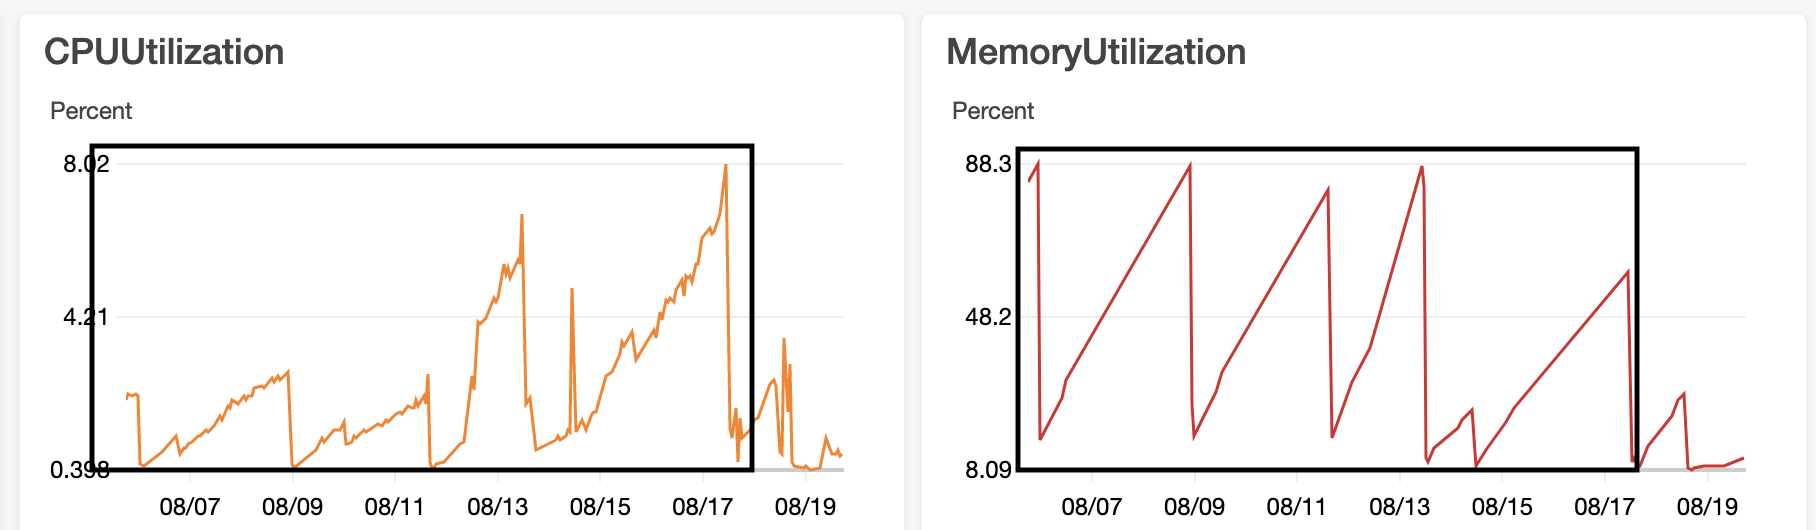
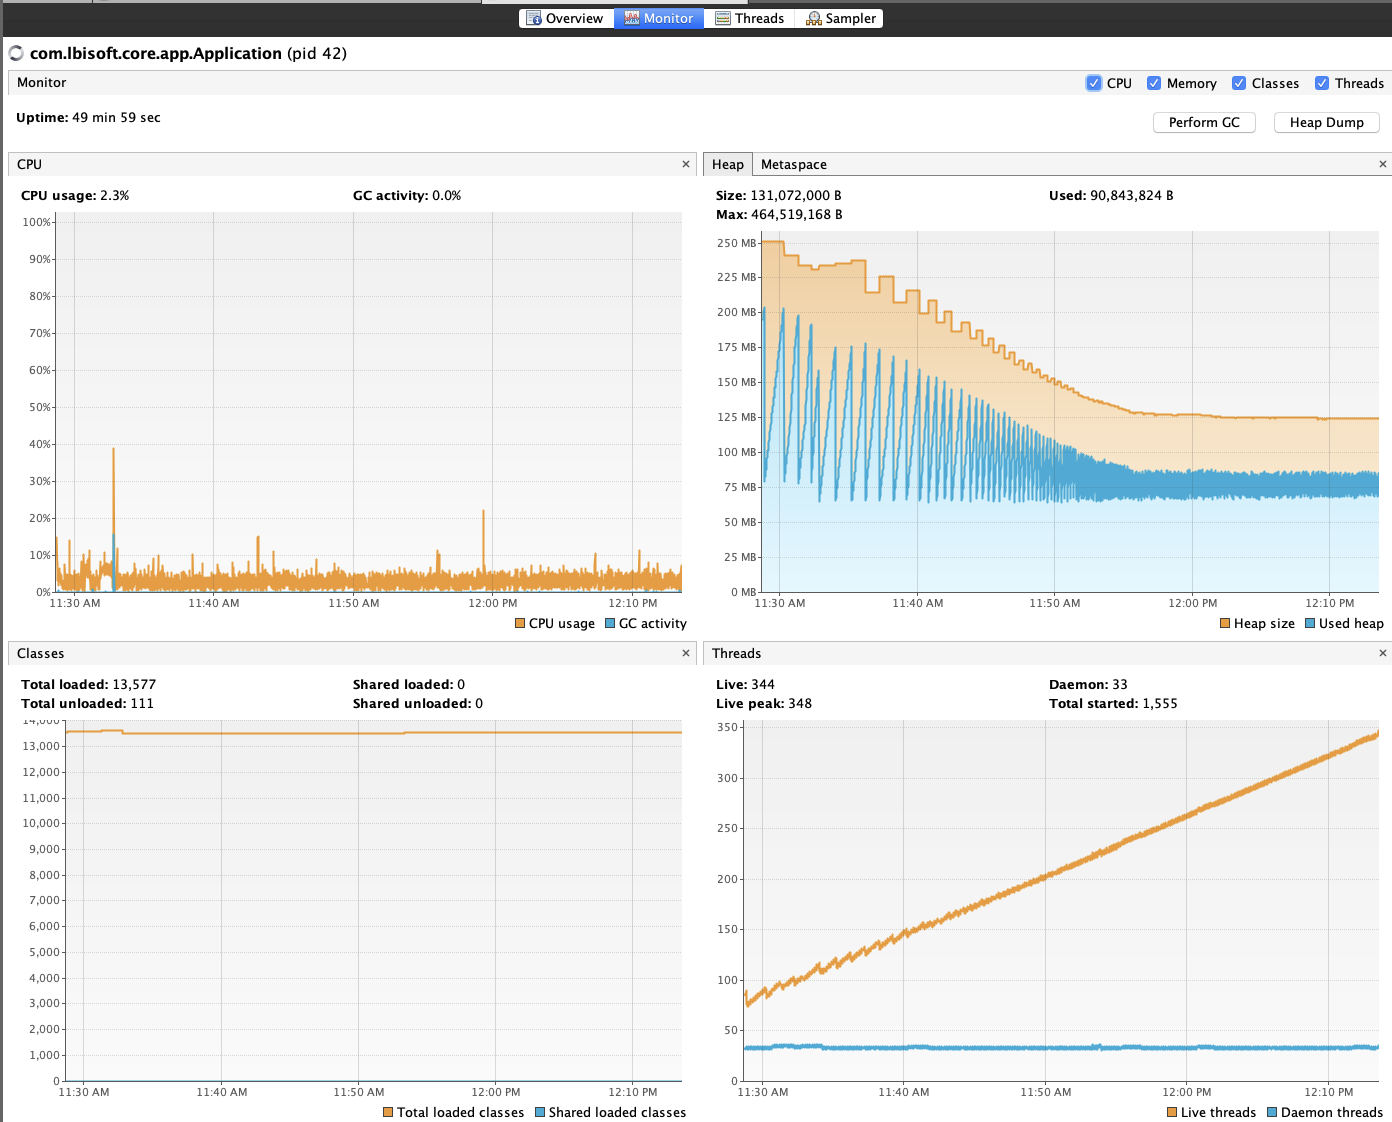
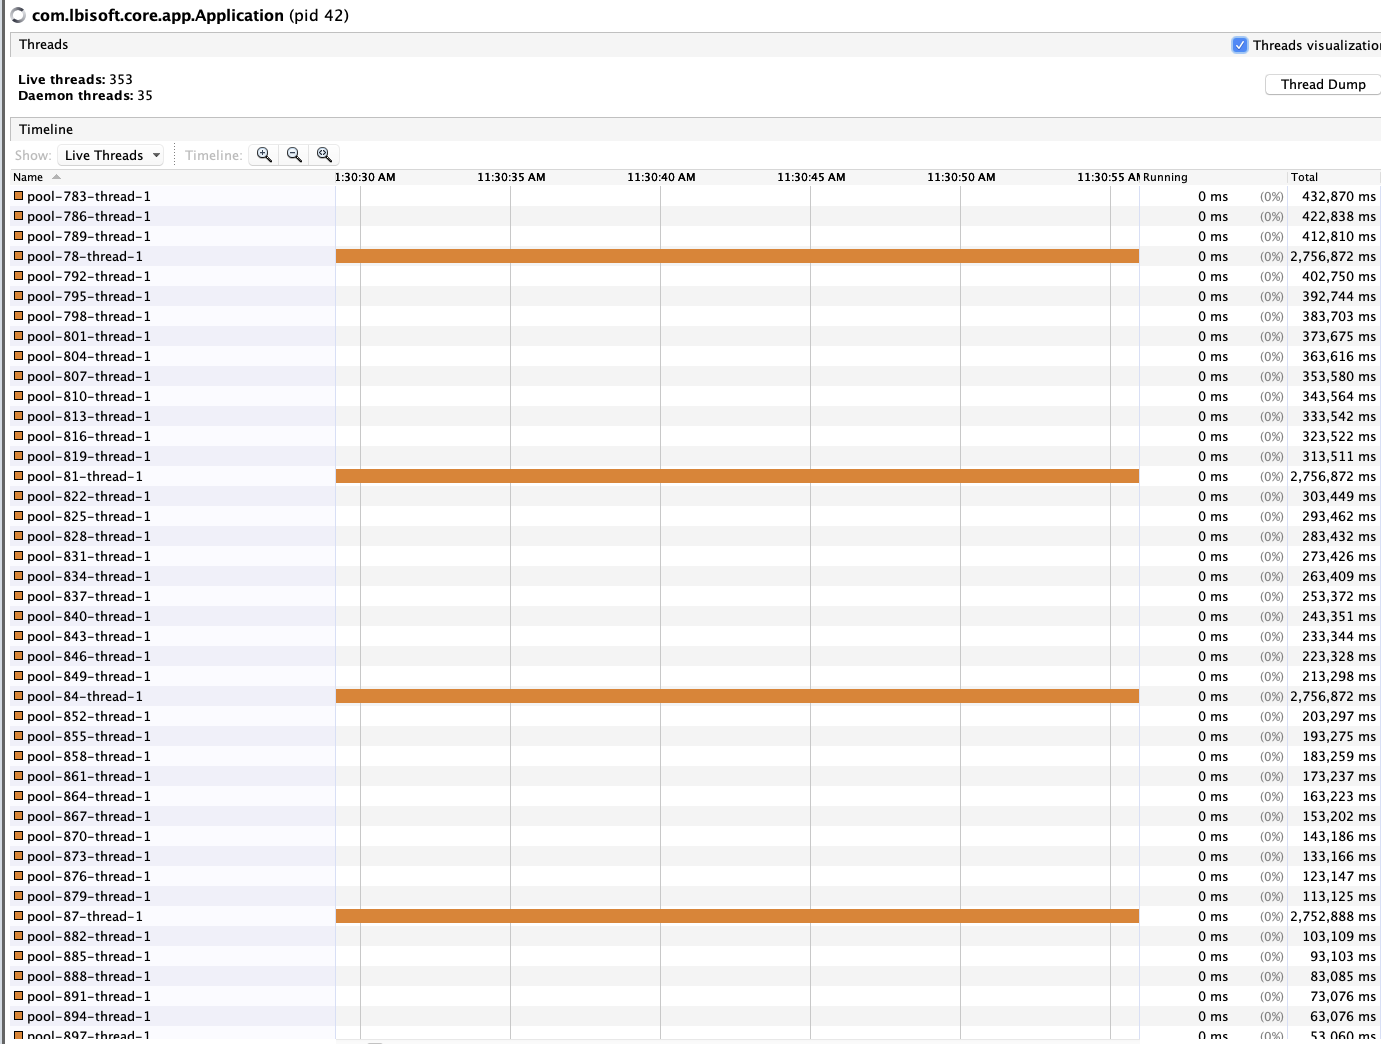
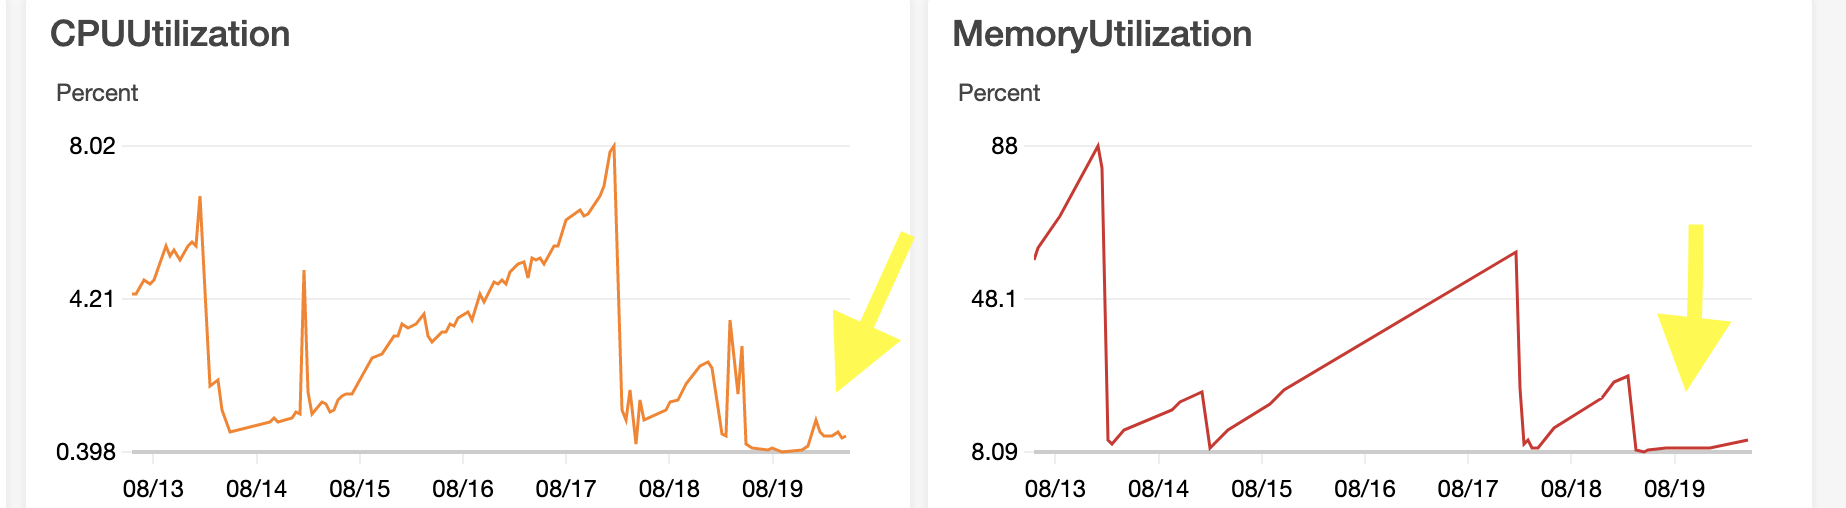
The following images are an example of what memory and CPU utilization should NOT look like. In the first image, the memory just about maxes out, then the app crashes and it significantly drops. This is not typical behavior. In the second image, you can see that the number of threads continues to increase over time with no dips. This is a key detail to help us realize that there is an issue with thread pools not being properly disposed of. Finally, the third image confirms this analysis.
If you are following along with my code on GitHub you can start the app with the command listed above. Then simply hit this endpoint using curl or your web browser to create a thread-related memory leak. Each time you hit this endpoint it will create more memory leaks!
curl localhost:8080/threads
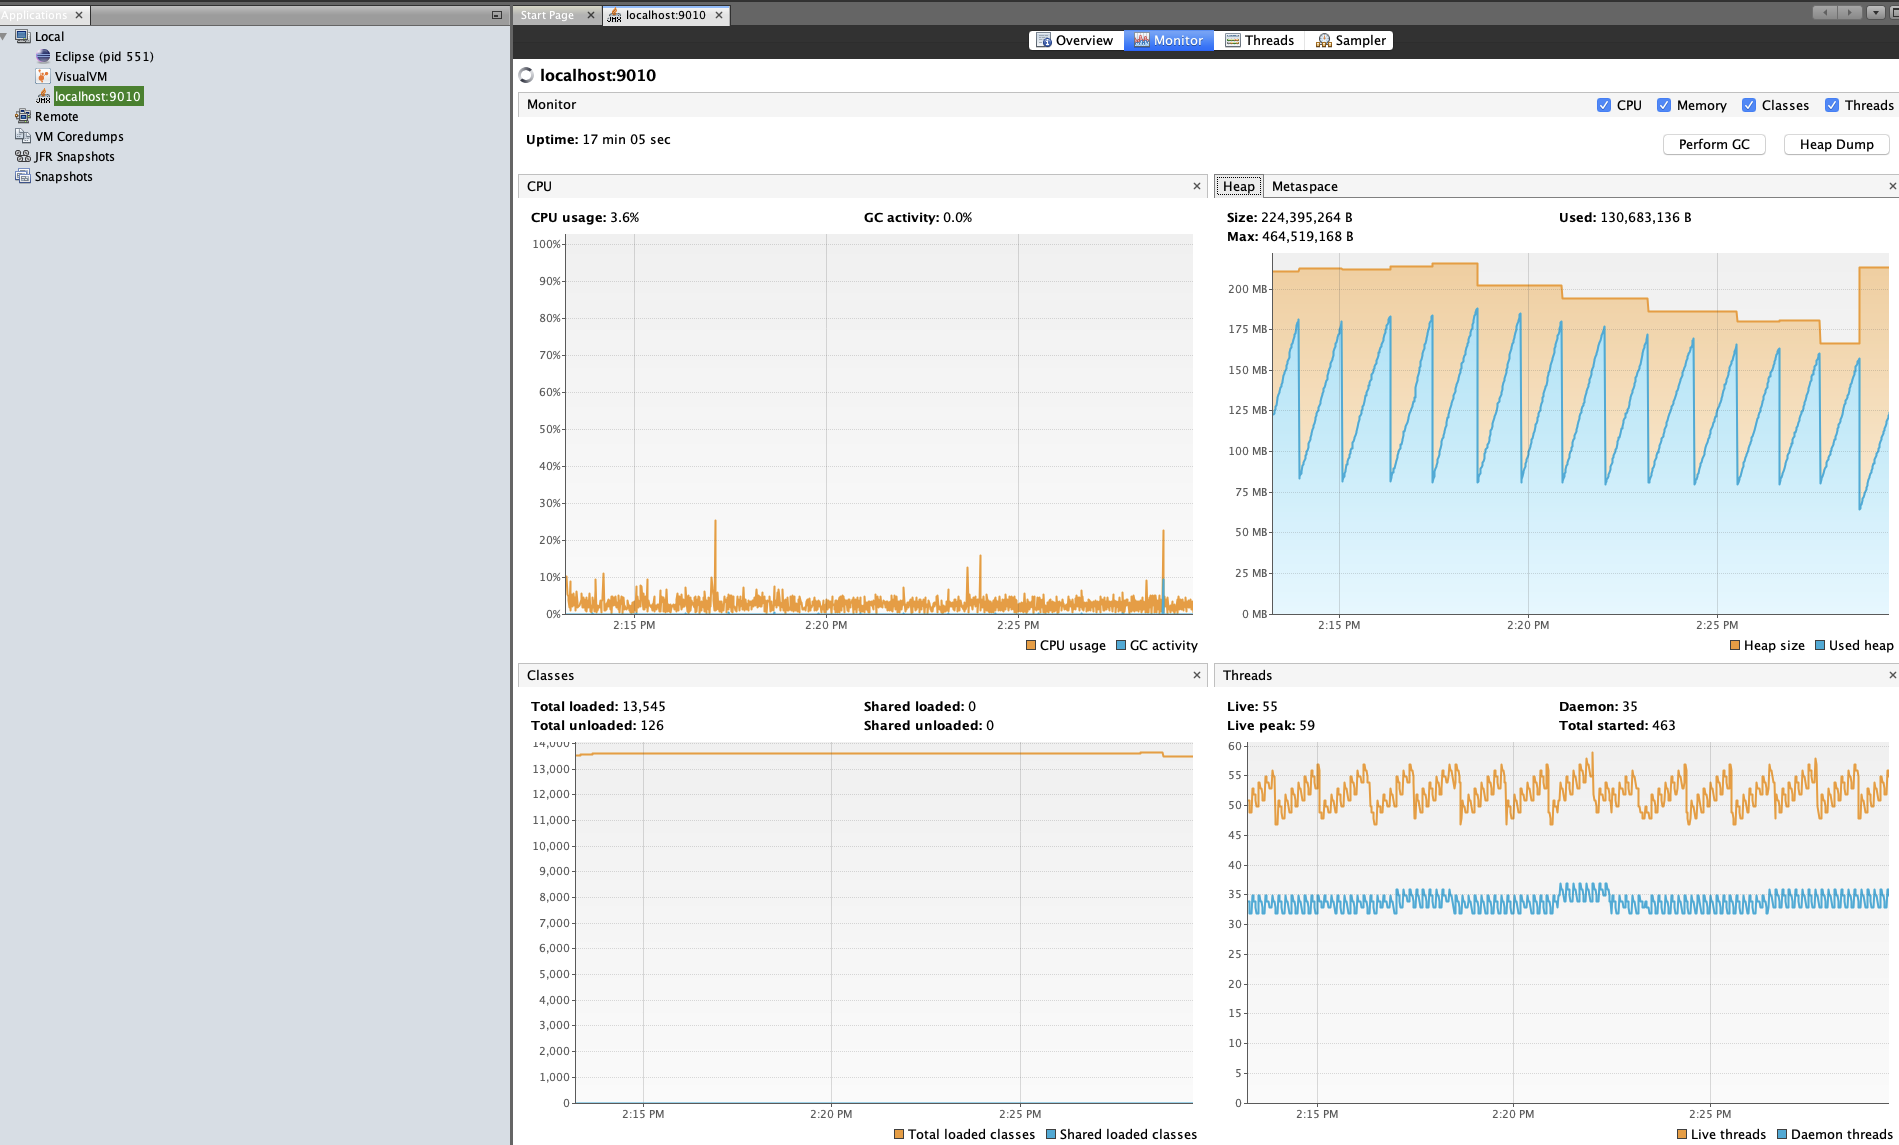
If your memory leak has to do with misuse of thread pools you will see a large number of threads that do not get cleaned up. This may indicate that there is something in your application that is not managing threads well.
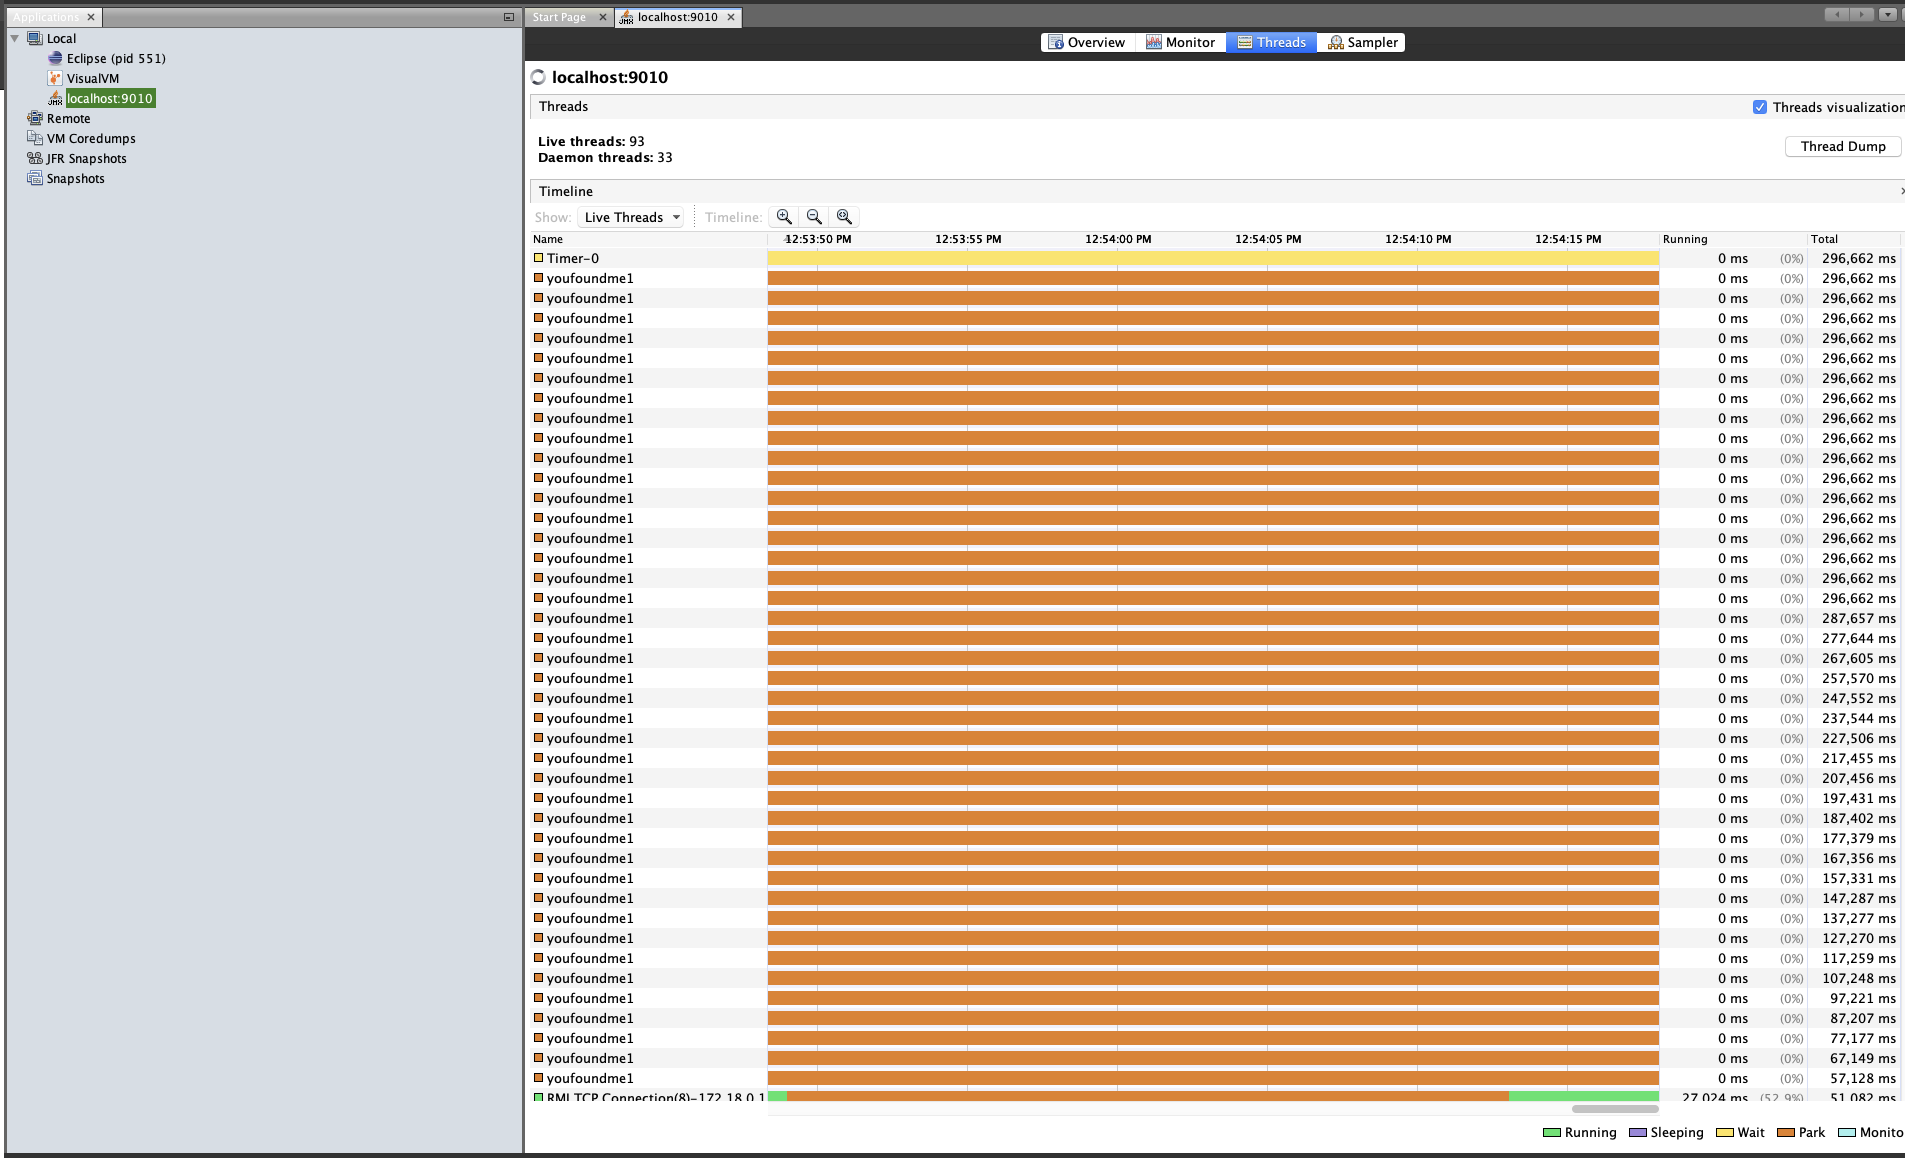
A very useful tool for identifying where threads are coming from is to apply a name to threads in a pool. You can take a look at this StackOverflow answer for multiple ways to accomplish this based on your implementation. Here is what labels will look like:
There is no one size fits all fix for this type of leak but once you find the source of the problem you can implement a solution. I would first find out where thread pools are configured in your application. Then I would look for what components are using concurrent programming (multiple threads). It may be that you are creating new thread pools when you can reuse the same one. If that is the case then you will want to put some infrastructure in place to centralize the creation of a thread pool(s). Alternatively, you can abstract the thread pool instantiation to a higher-level component.
Once you have a fix in place, you can now reuse the tools we have spoken about to see how the metrics have changed. The below images show how the applications should behave. The first is a Visual VM metric showing very consistent nice up and down spikes. The last shows how the metrics have flatlines after a fix was put in, which is a good thing.
I was just like to thank Runtik Wankhade for developing this super useful tool for creating blog cover photos. Give it a try!