Profile Spring Boot with Visual VM

P
I'm a software engineer interested in Cloud technologies and web applications.
Search for a command to run...
I'm a software engineer interested in Cloud technologies and web applications.
No comments yet. Be the first to comment.
A lot of the documentation can be found here on Spring's website about the threat. The most important part is the second paragraph. Spring Boot users are only affected by this vulnerability if they have switched the default logging system to Log4J2....

AWS CDK Pro Tips

Query a Postgres database using a Lambda in 5 minutes!

Beware Implicitly 'any'!

Learn about the benefits of serverless

Today, I would like to give a quick overview of how to use Visual VM to diagnose memory leaks in a Spring Boot application. Debugging memory leaks is a critical skill to have when developing enterprise-level applications. These types of issues can take days or weeks to cause serious errors, but you will be happy to know how to isolate them when they do occur!
First, go over to the Visual VM website and download the application zip. It is a standalone application so you do not need to install it. Unzip the files someplace convenient.
In this step, I am going to assume that you can run your Spring Boot application from the command line. If you do not have your own application you can check out my spring boot memory leak project to follow along. If you <3 containers like me and have docker installed, simply run the following command:
docker-compose up profile
Else, you can run the Spring Boot app as you normally would. Once you are able to run your application from a terminal we need to pass some JVM arguments to allow Visual VM to profile your application and help you detect memory leaks:
mvn spring-boot:run -Dspring-boot.run.jvmArguments="-Xdebug -Dcom.sun.management.jmxremote -Dcom.sun.management.jmxremote.port=9010 -Dcom.sun.management.jmxremote.rmi.port=9010 -Dcom.sun.management.jmxremote.authenticate=false -Dcom.sun.management.jmxremote.ssl=false -Djava.rmi.server.hostname=localhost"
NOTE: you can replace localhost with the IP address of a remote server if you are not profiling locally.
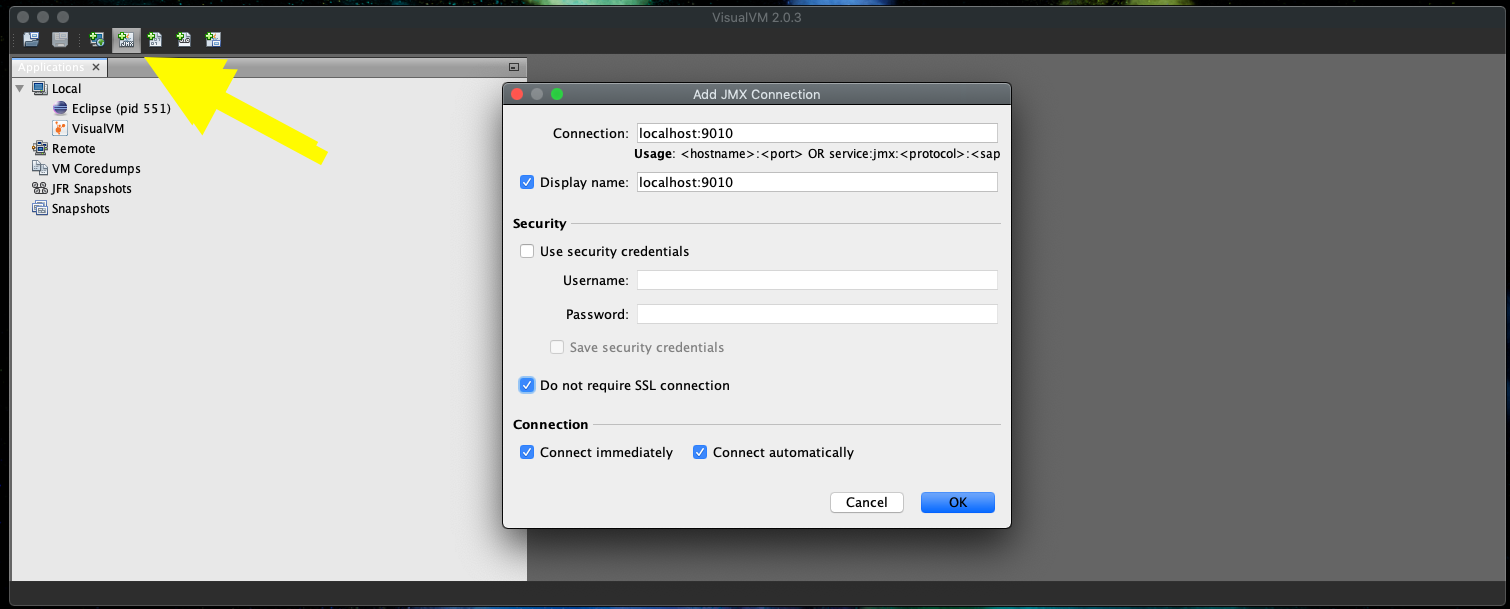
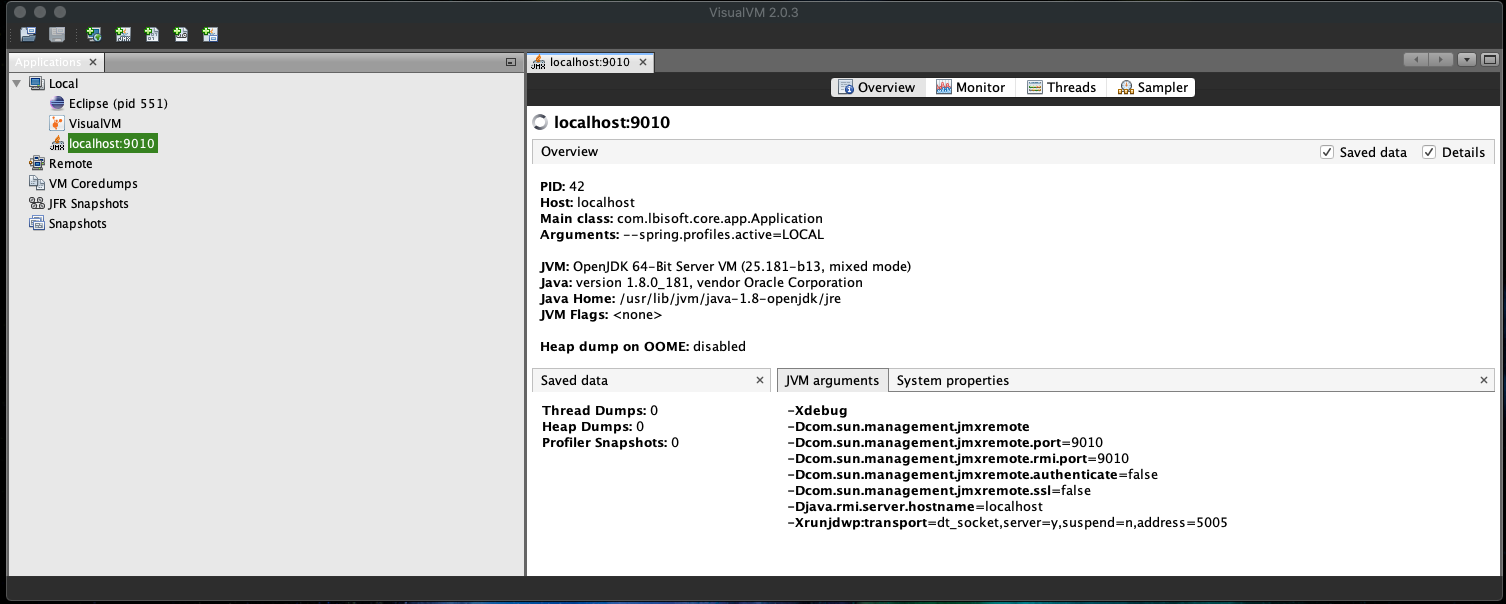
Finally, navigate to the unzipped application folder and execute thevisualvm file which is located in the binary folder (bin). Make sure your Spring Boot application is running and click the "Add JMX Connection" in Visual VM. Next set the connection to localhost:9010 (or whichever host you used) and click ok. There should now be a colored icon on the left-hand side which indicates you are connected to your app! If it is greyed out that means there is an issue with connecting Visual VM to your application. Double click the connection and we can now investigate memory leaks!
I will be posting some real-life examples of how to find and FIX memory leaks! Keep an eye out! Happy debugging!
Take a look at my next blog post to learn more about profiling thread related memory leaks in a Spring Boot application.
I was just like to thank Runtik Wankhade for developing this super useful tool for creating blog cover photos. Give it a try!