Monitoring Memory Leaks with AWS CloudWatch

P
I'm a software engineer interested in Cloud technologies and web applications.
Search for a command to run...
I'm a software engineer interested in Cloud technologies and web applications.
No comments yet. Be the first to comment.
AWS series dedicated to AWS CloudWatch. This should be your AWS command center!
Control Center This week I deployed a production full-stack application to AWS. This was the first web application that I deployed that relied solely on Amazon CloudWatch for logging. Amazon CloudWatch has been the control center for metrics on the...
A lot of the documentation can be found here on Spring's website about the threat. The most important part is the second paragraph. Spring Boot users are only affected by this vulnerability if they have switched the default logging system to Log4J2....

AWS CDK Pro Tips

Query a Postgres database using a Lambda in 5 minutes!

Beware Implicitly 'any'!

Learn about the benefits of serverless

I recently found a memory leak in one of my applications. This motivated me to write a post about how you can profile a Spring Boot web app using Visual VM. Today, I will be discussing how I initially found this leak using Amazon CloudWatch and what steps I took to prevent unexpected mayhem from occurring!
First off — what is Amazon CloudWatch? CloudWatch is the control center for monitoring all your AWS resources in one place. You should regularly monitor your applications to ensure there are no surprise outages.
After I wake up I prepare breakfast and a coffee while I prepare for my daily standup meeting. In doing so, I normally log into our AWS account and take a look at CloudWatch to see traffic and look for anything out of the ordinary. CloudWatch is an Amazon service you can use to monitor AWS resources.
We had recently deployed a new containerized application to AWS Elastic Container Service (ECS). I noticed a few unusual metrics with the new application. The CPU seemed to be very active despite not be used and the memory utilization was increasing near 90% then diving back down.
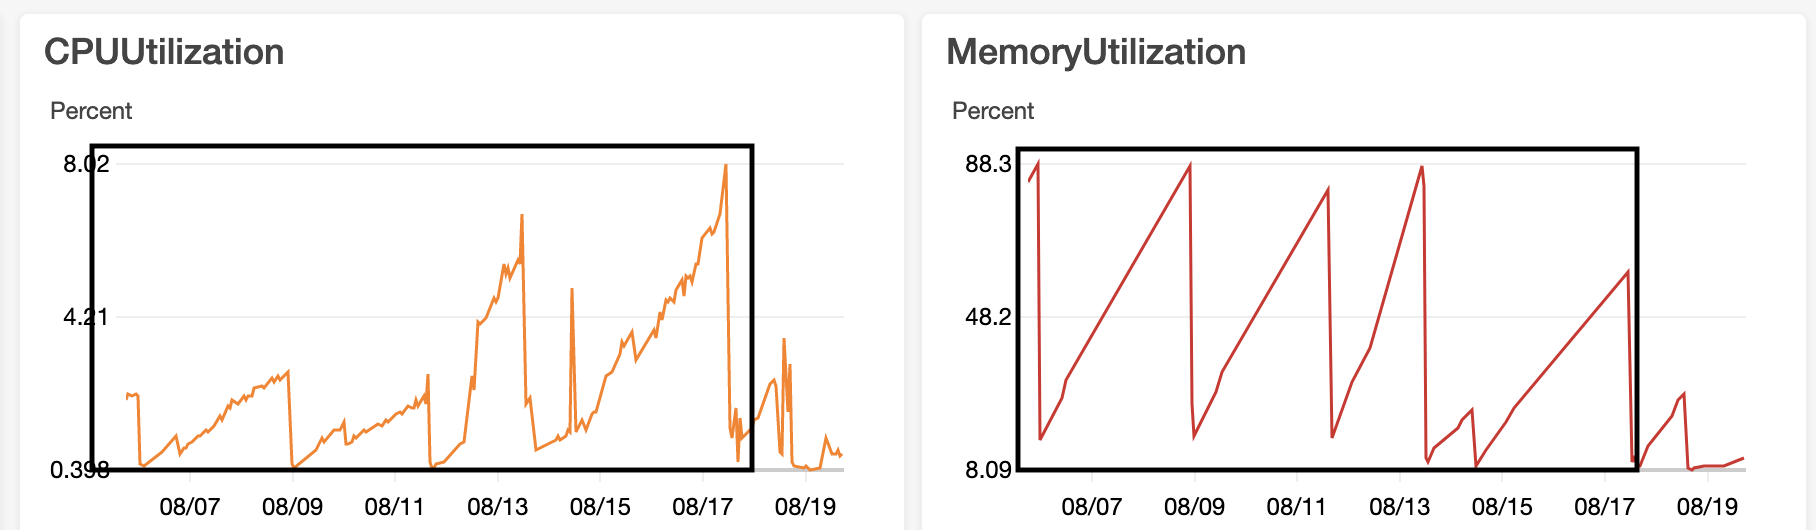 These are not good metrics!
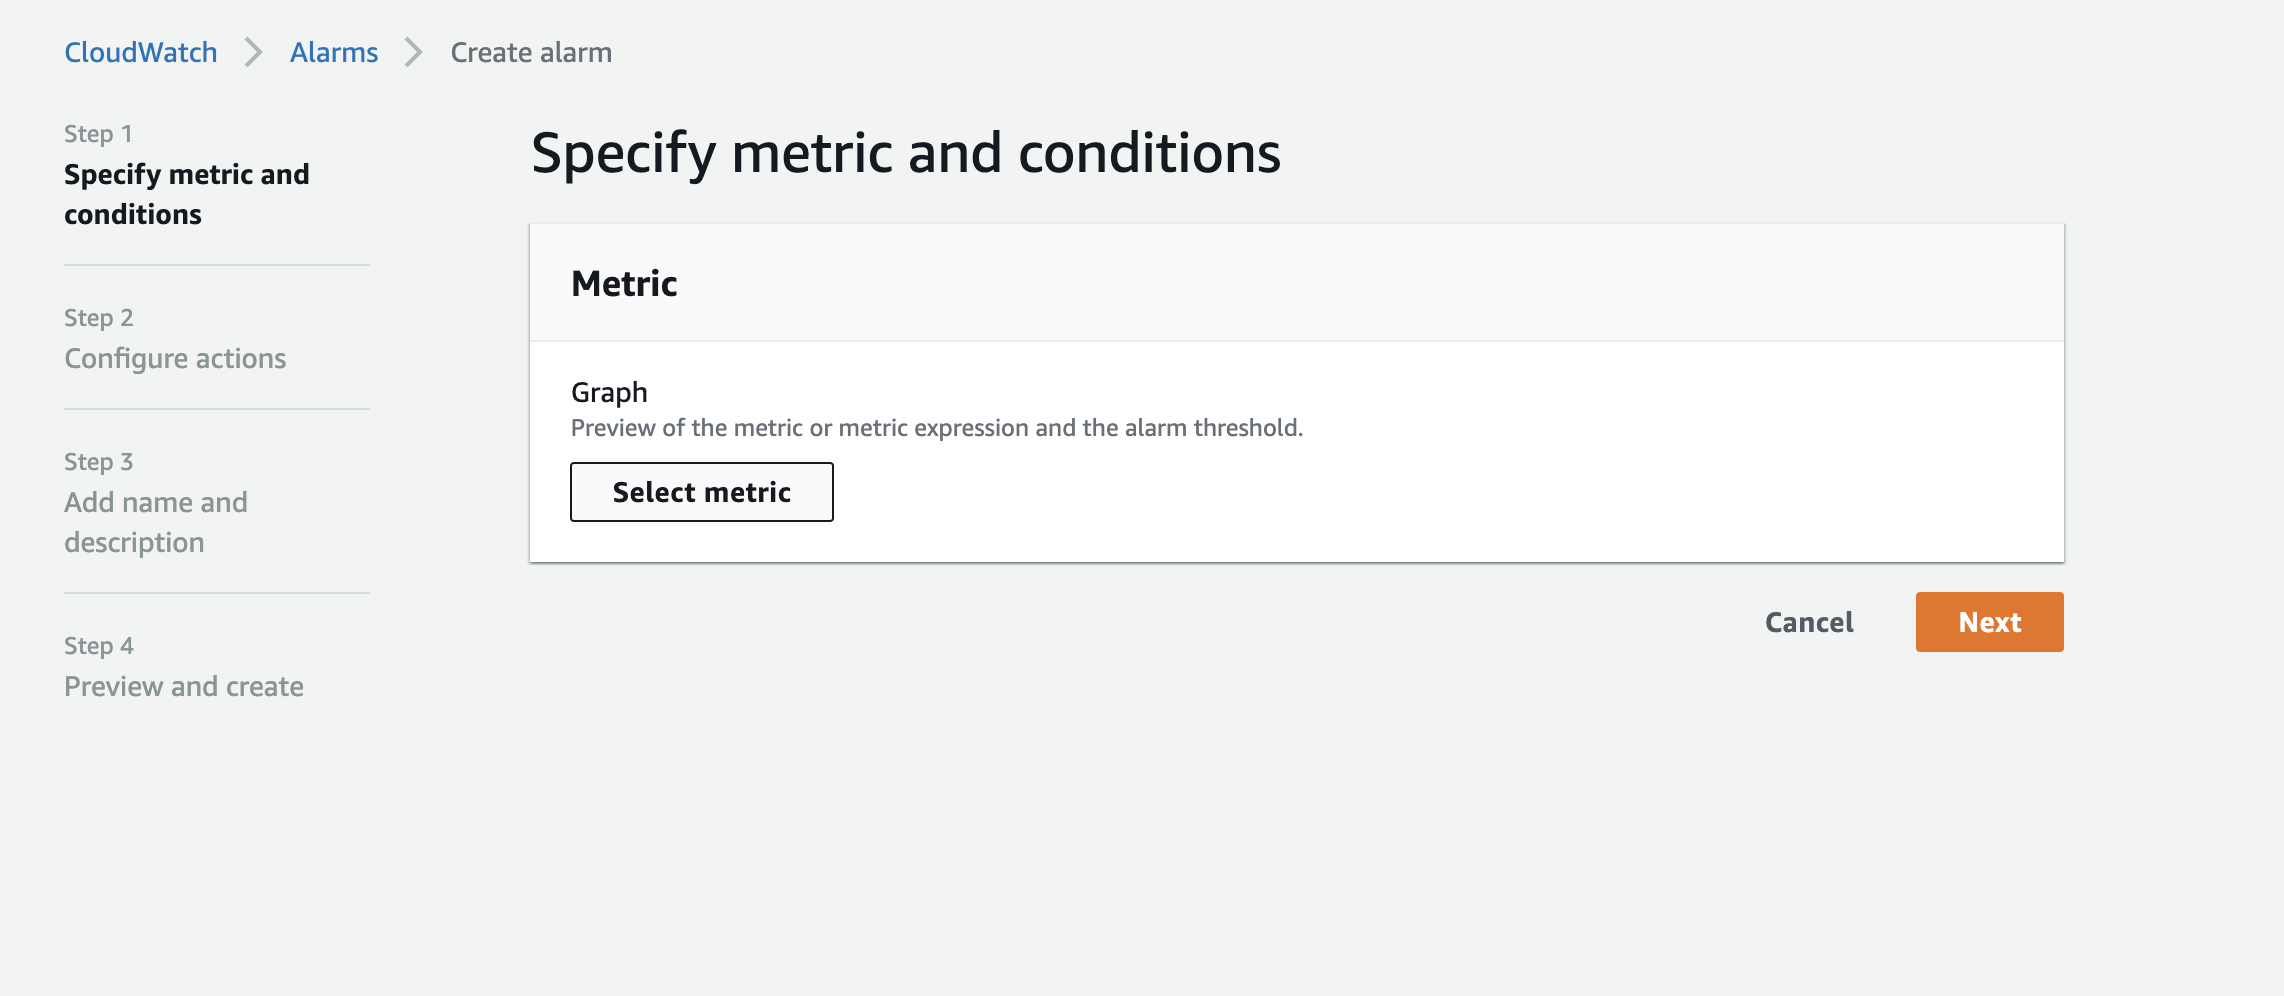
Immediately, I knew that something was not right. The app was frequently crashing which was causing the memory and CPU dips. Therefore, I set up a CloudWatch alarm with an SNS alert to email my team when the CPU spiked higher than 60%. In this case, someone could manually restart the application to reset the memory to prevent the application from crashing unexpectedly. This would be a bandaid until we found a proper solution. I documented the steps needed to create such an alarm.
Create an alarm from AWS CloudWatch

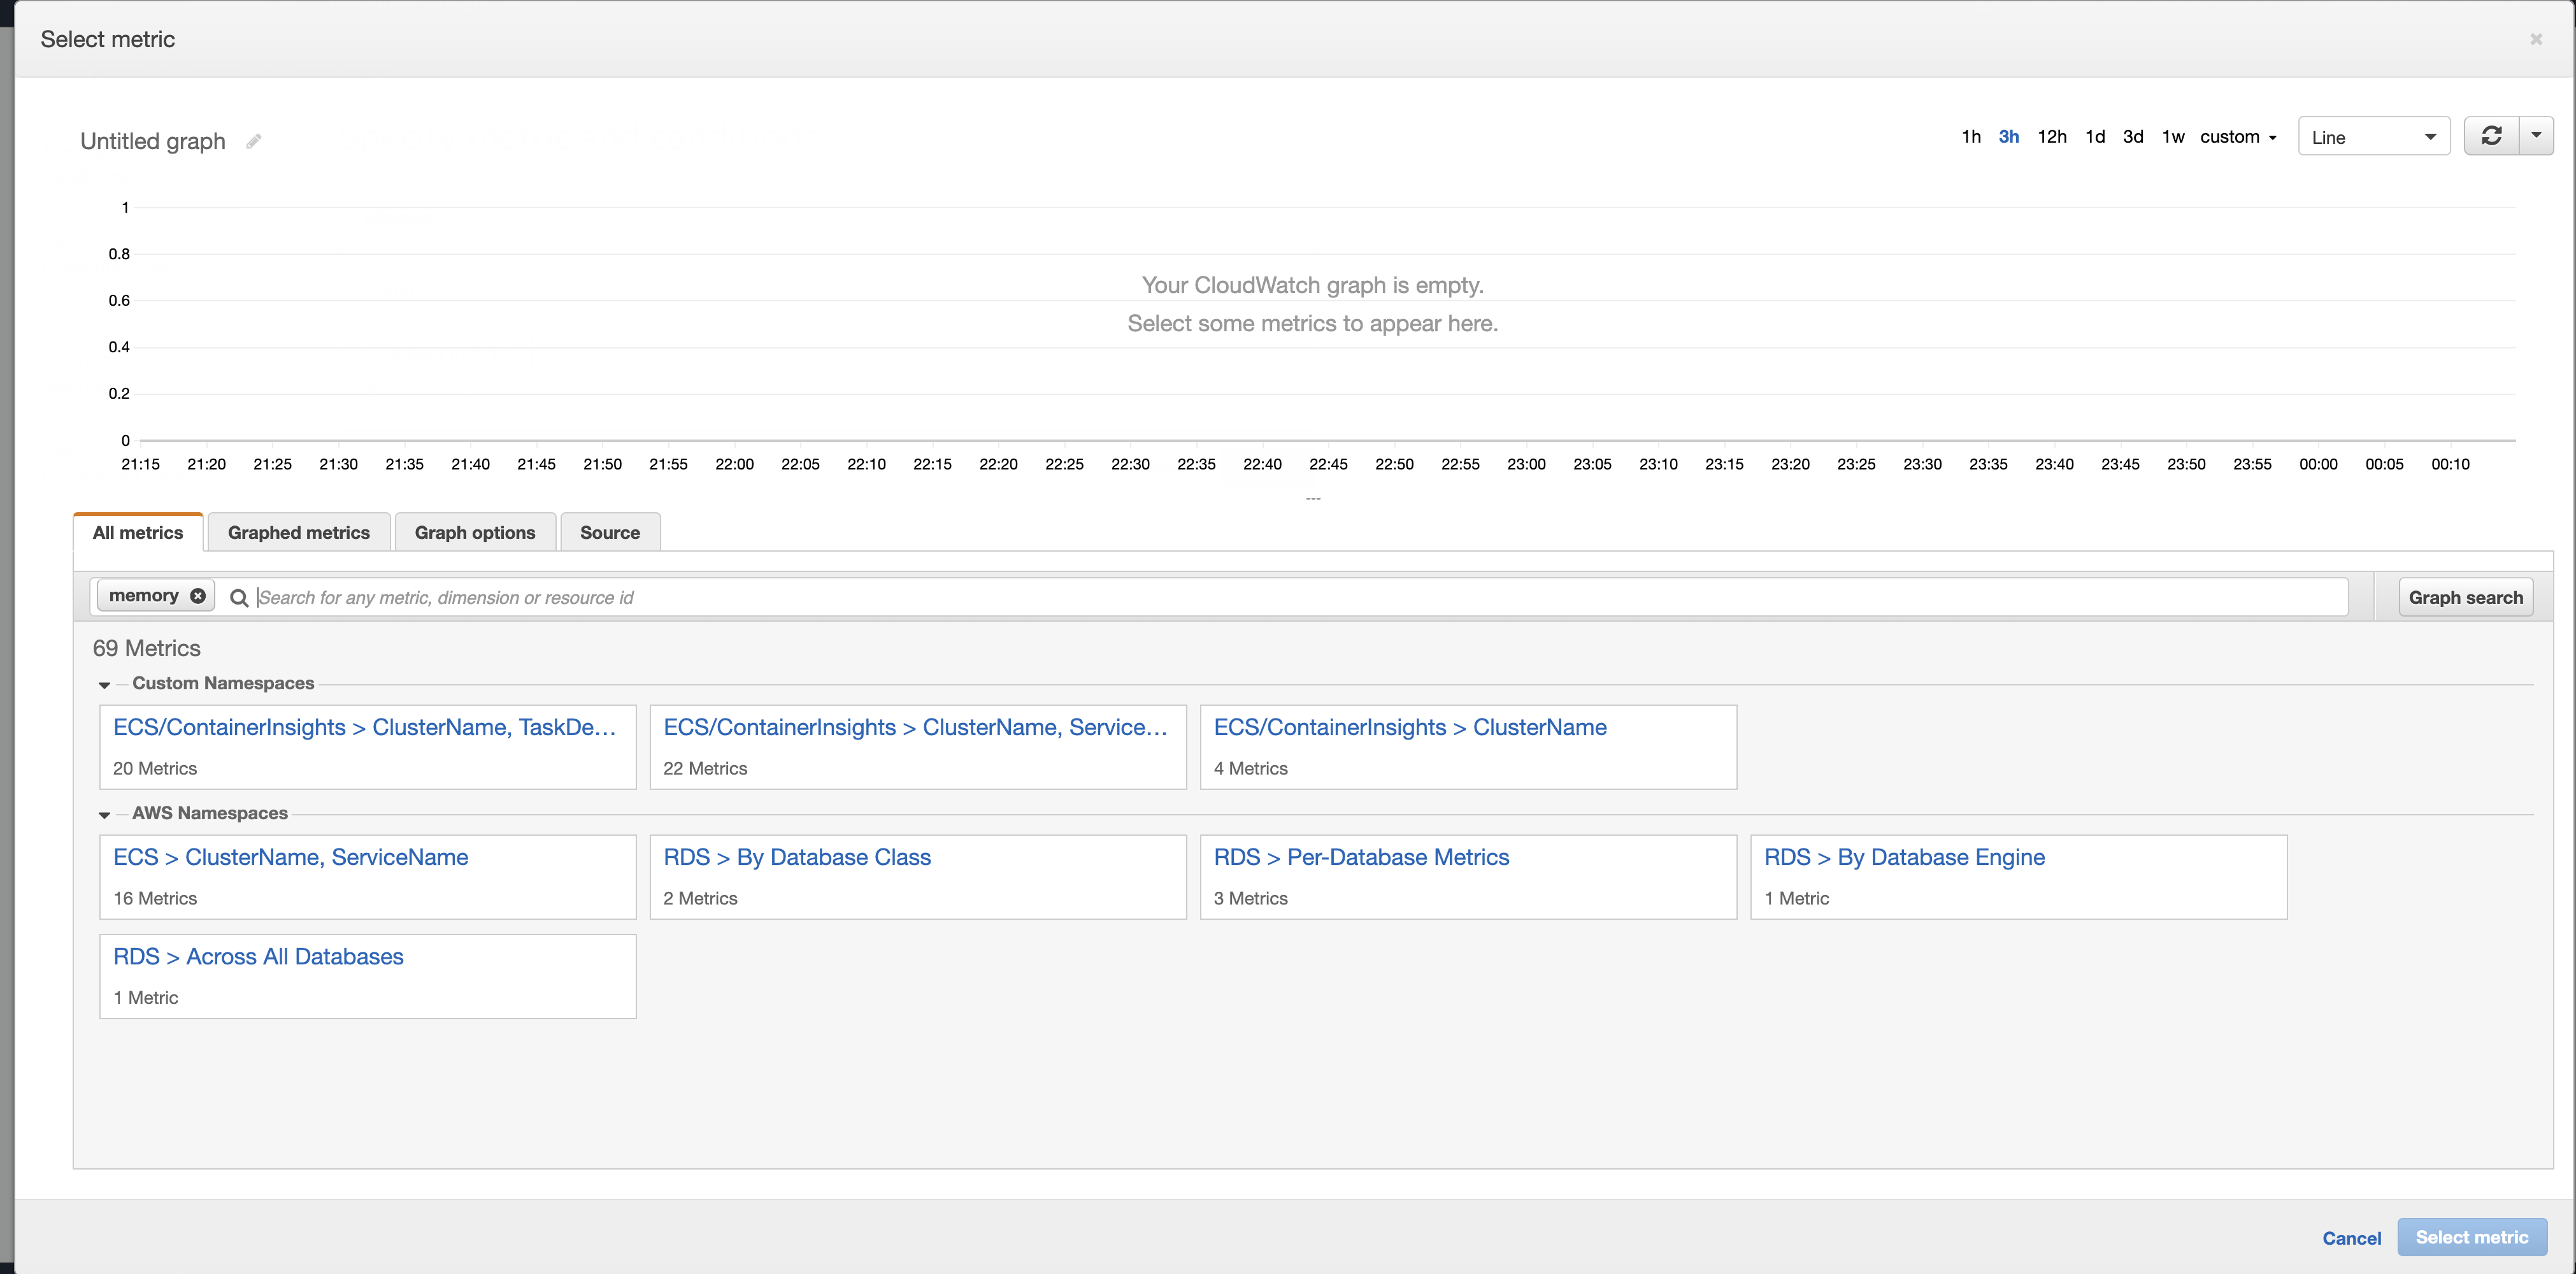
Select a metric for the alarm
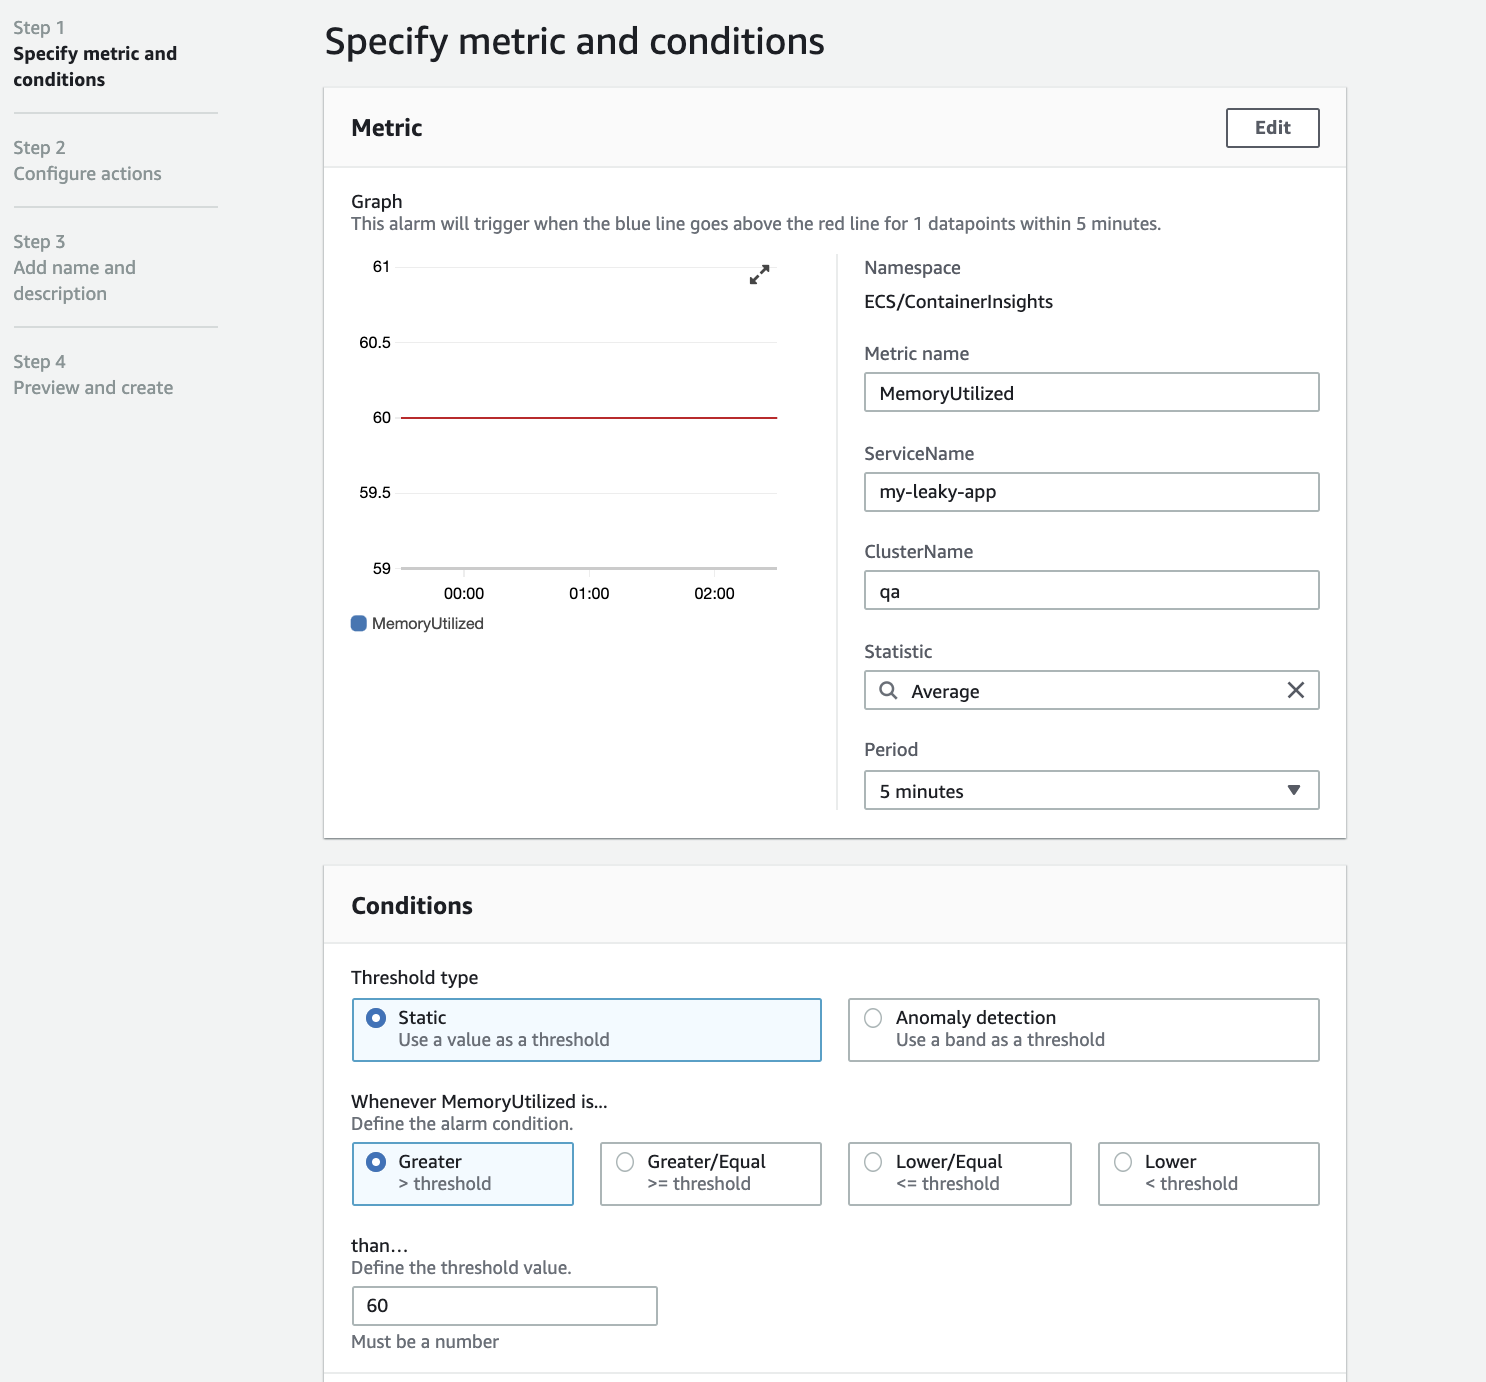
Select a metric category. Here I am going to use an ECS serviceName metric.
Select “MemoryUtilization” for your category
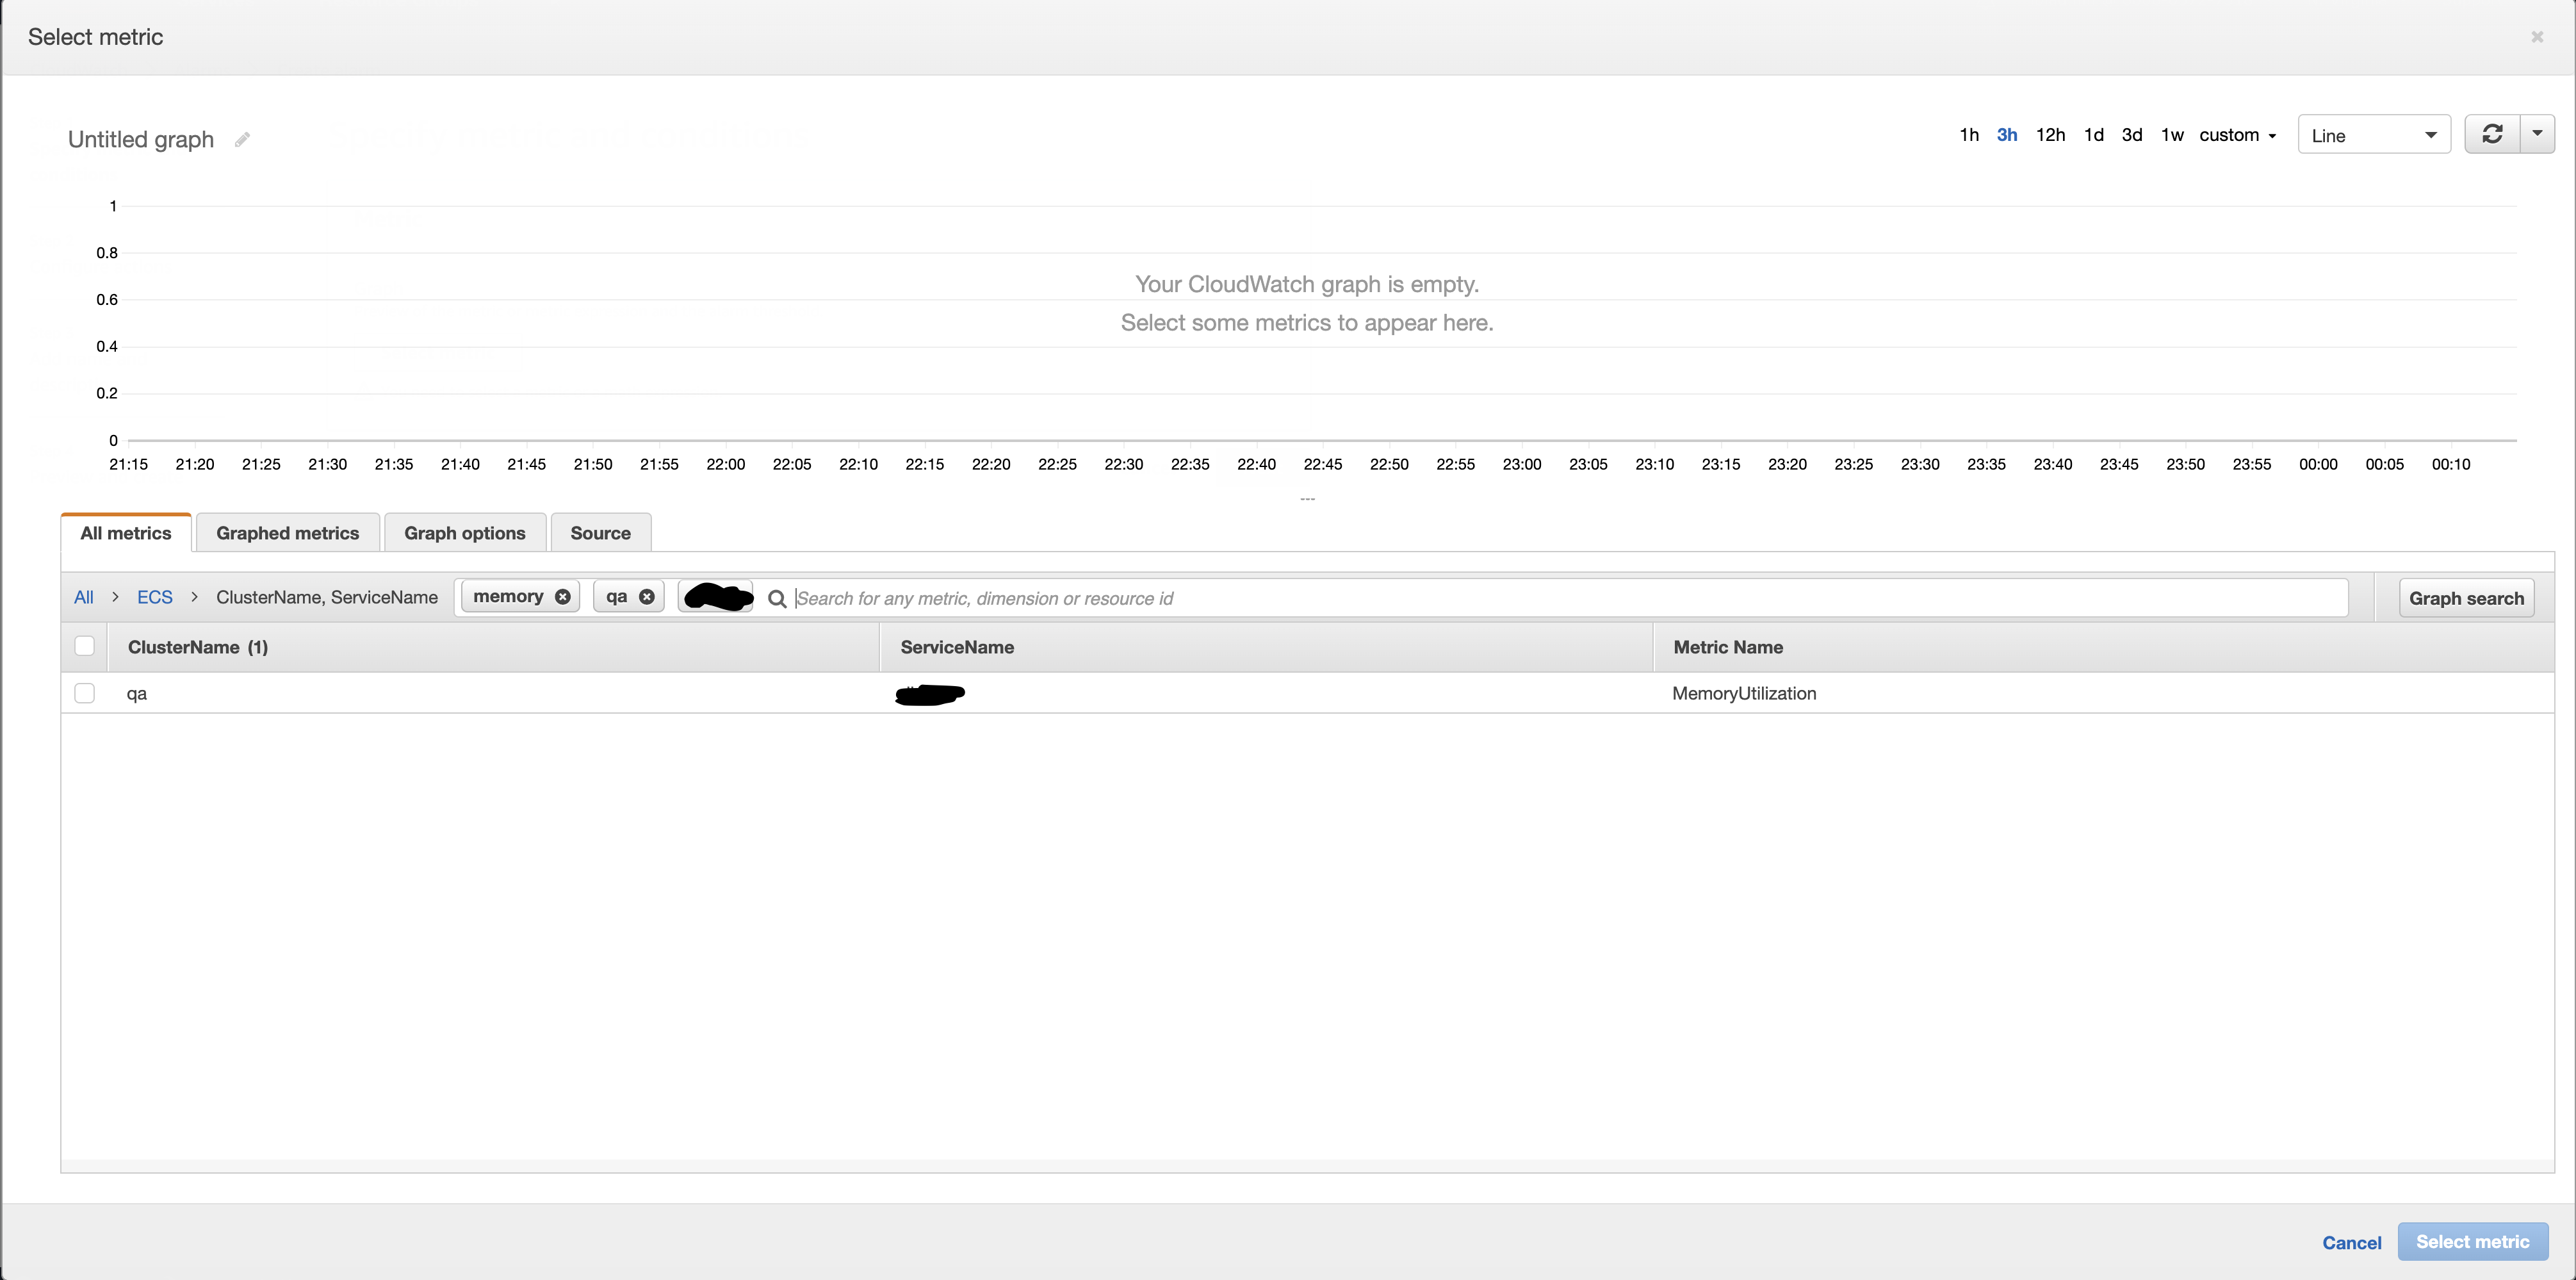
I set the alarm to go off if the average Memory Utilization was > 60%
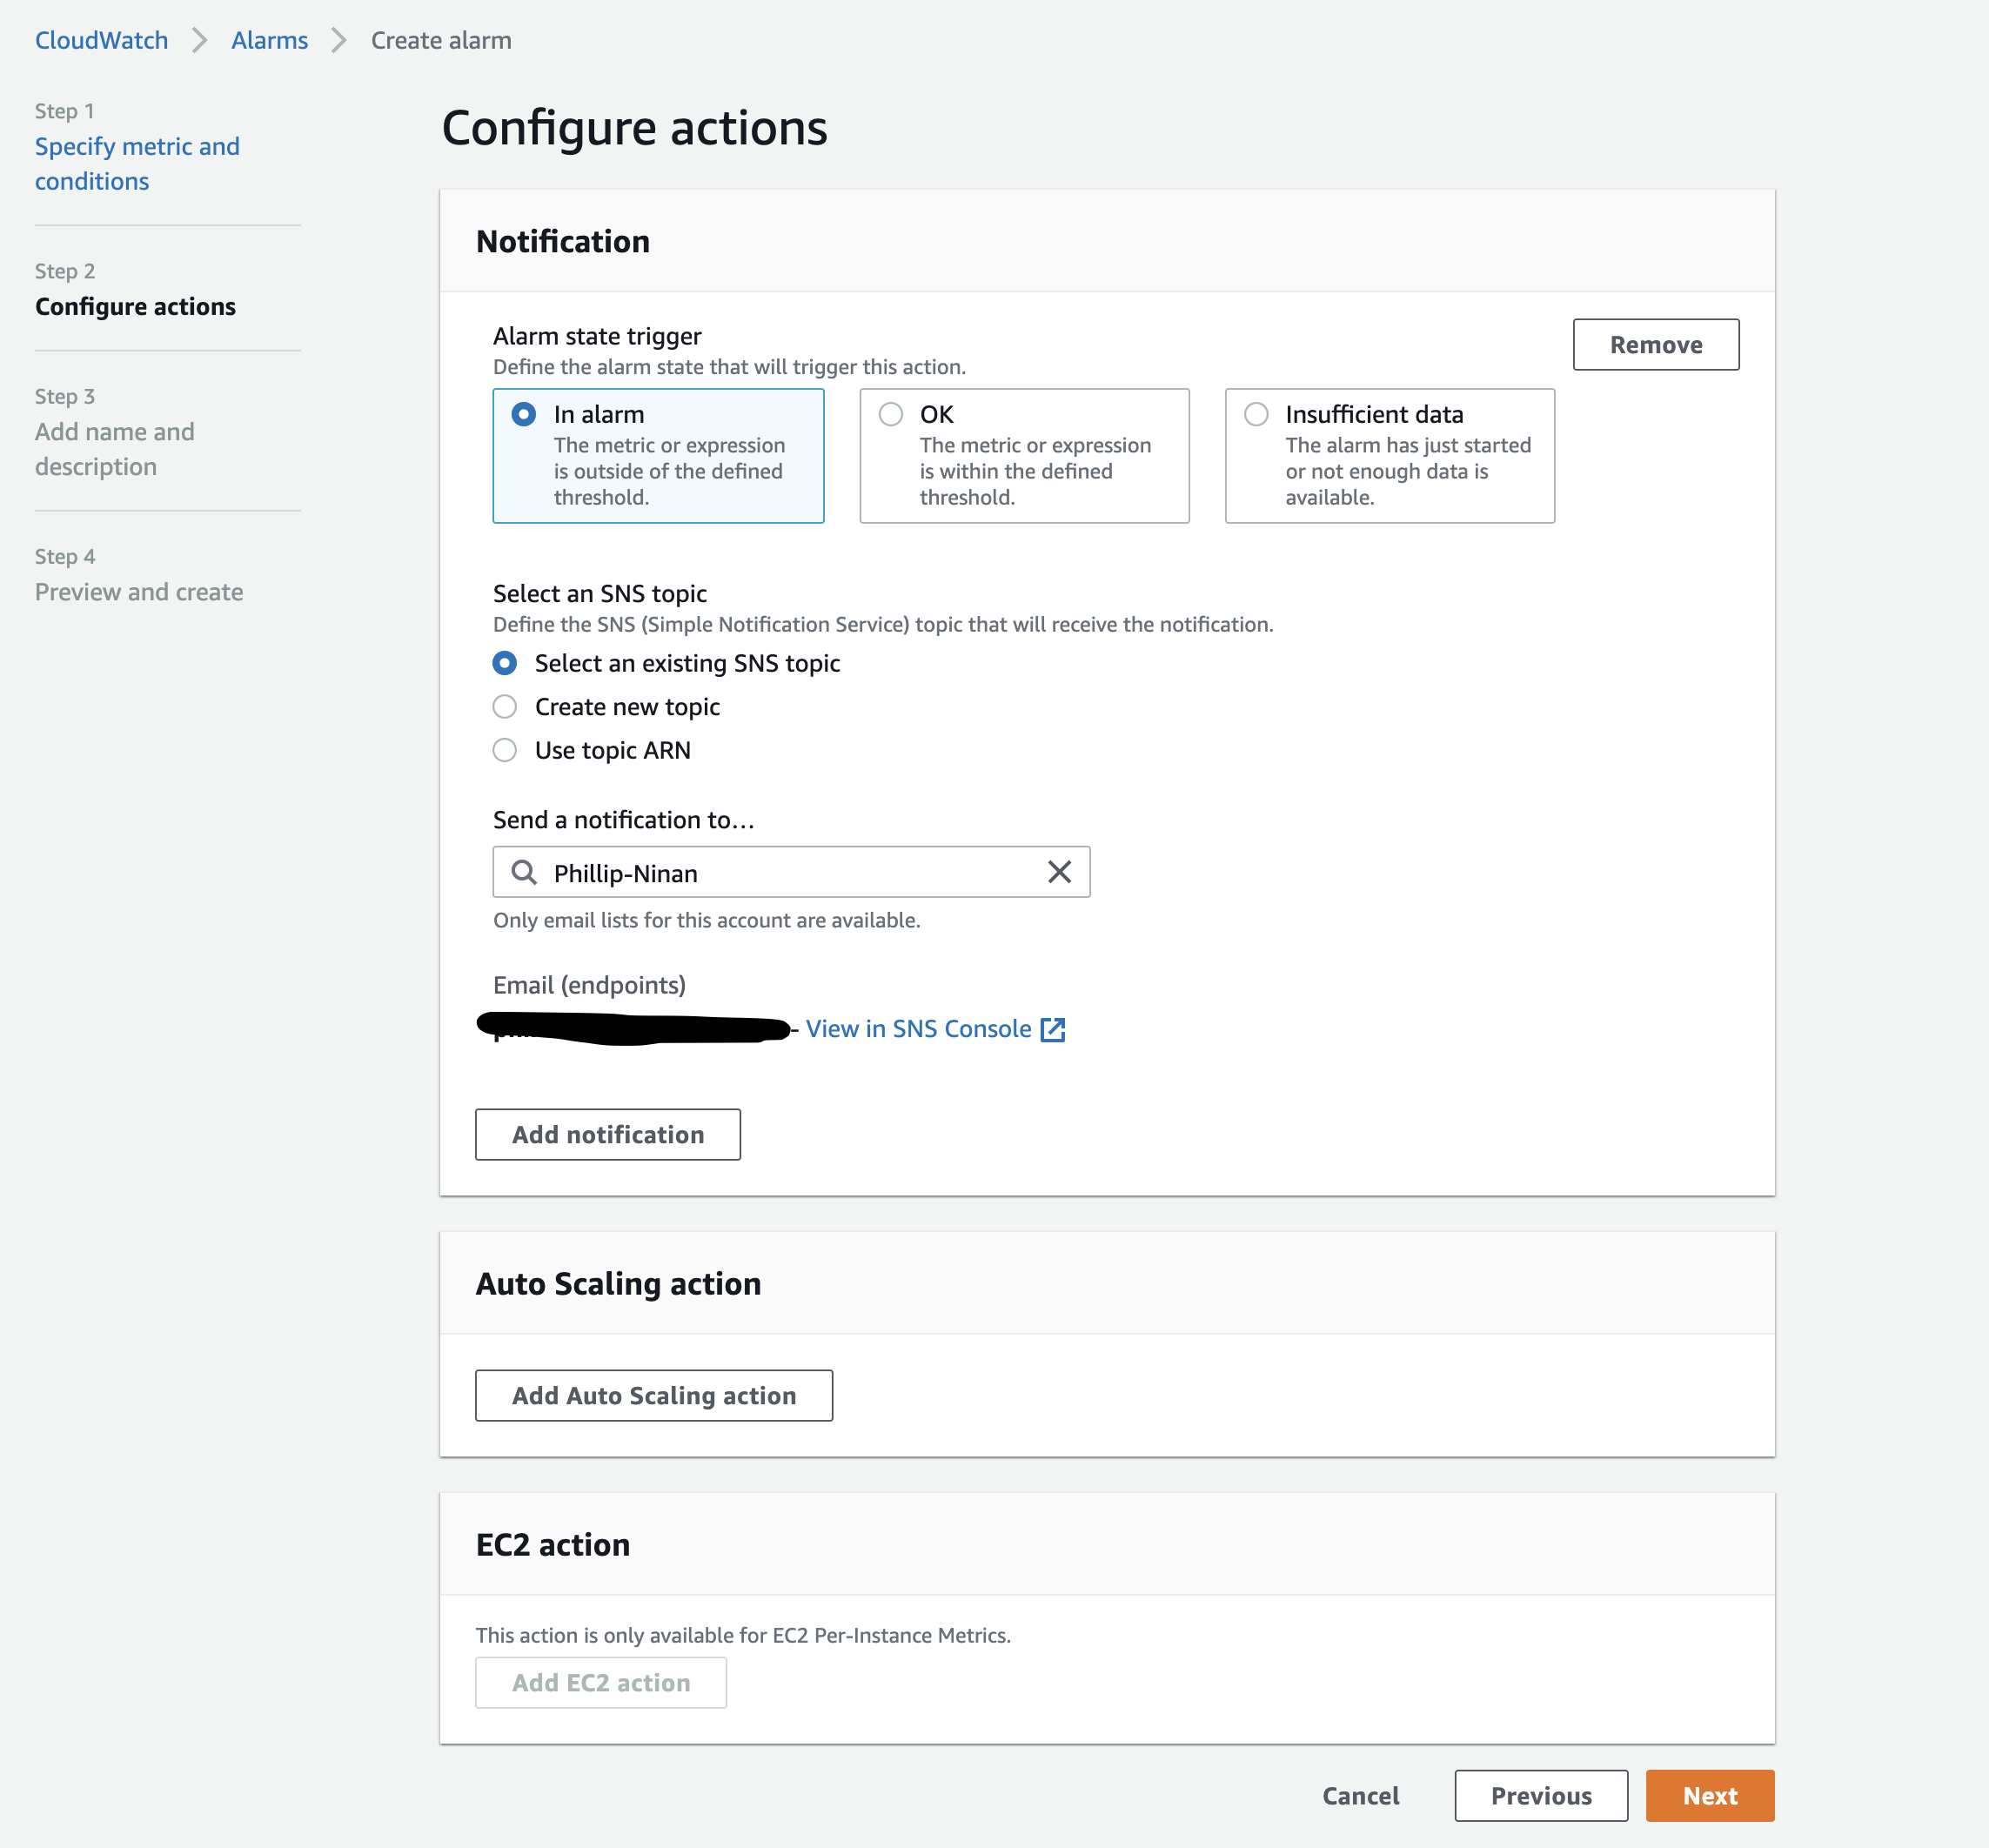
Use an SNS topic to send you or your team an email
Make sure to add a description to keep track of different alarms
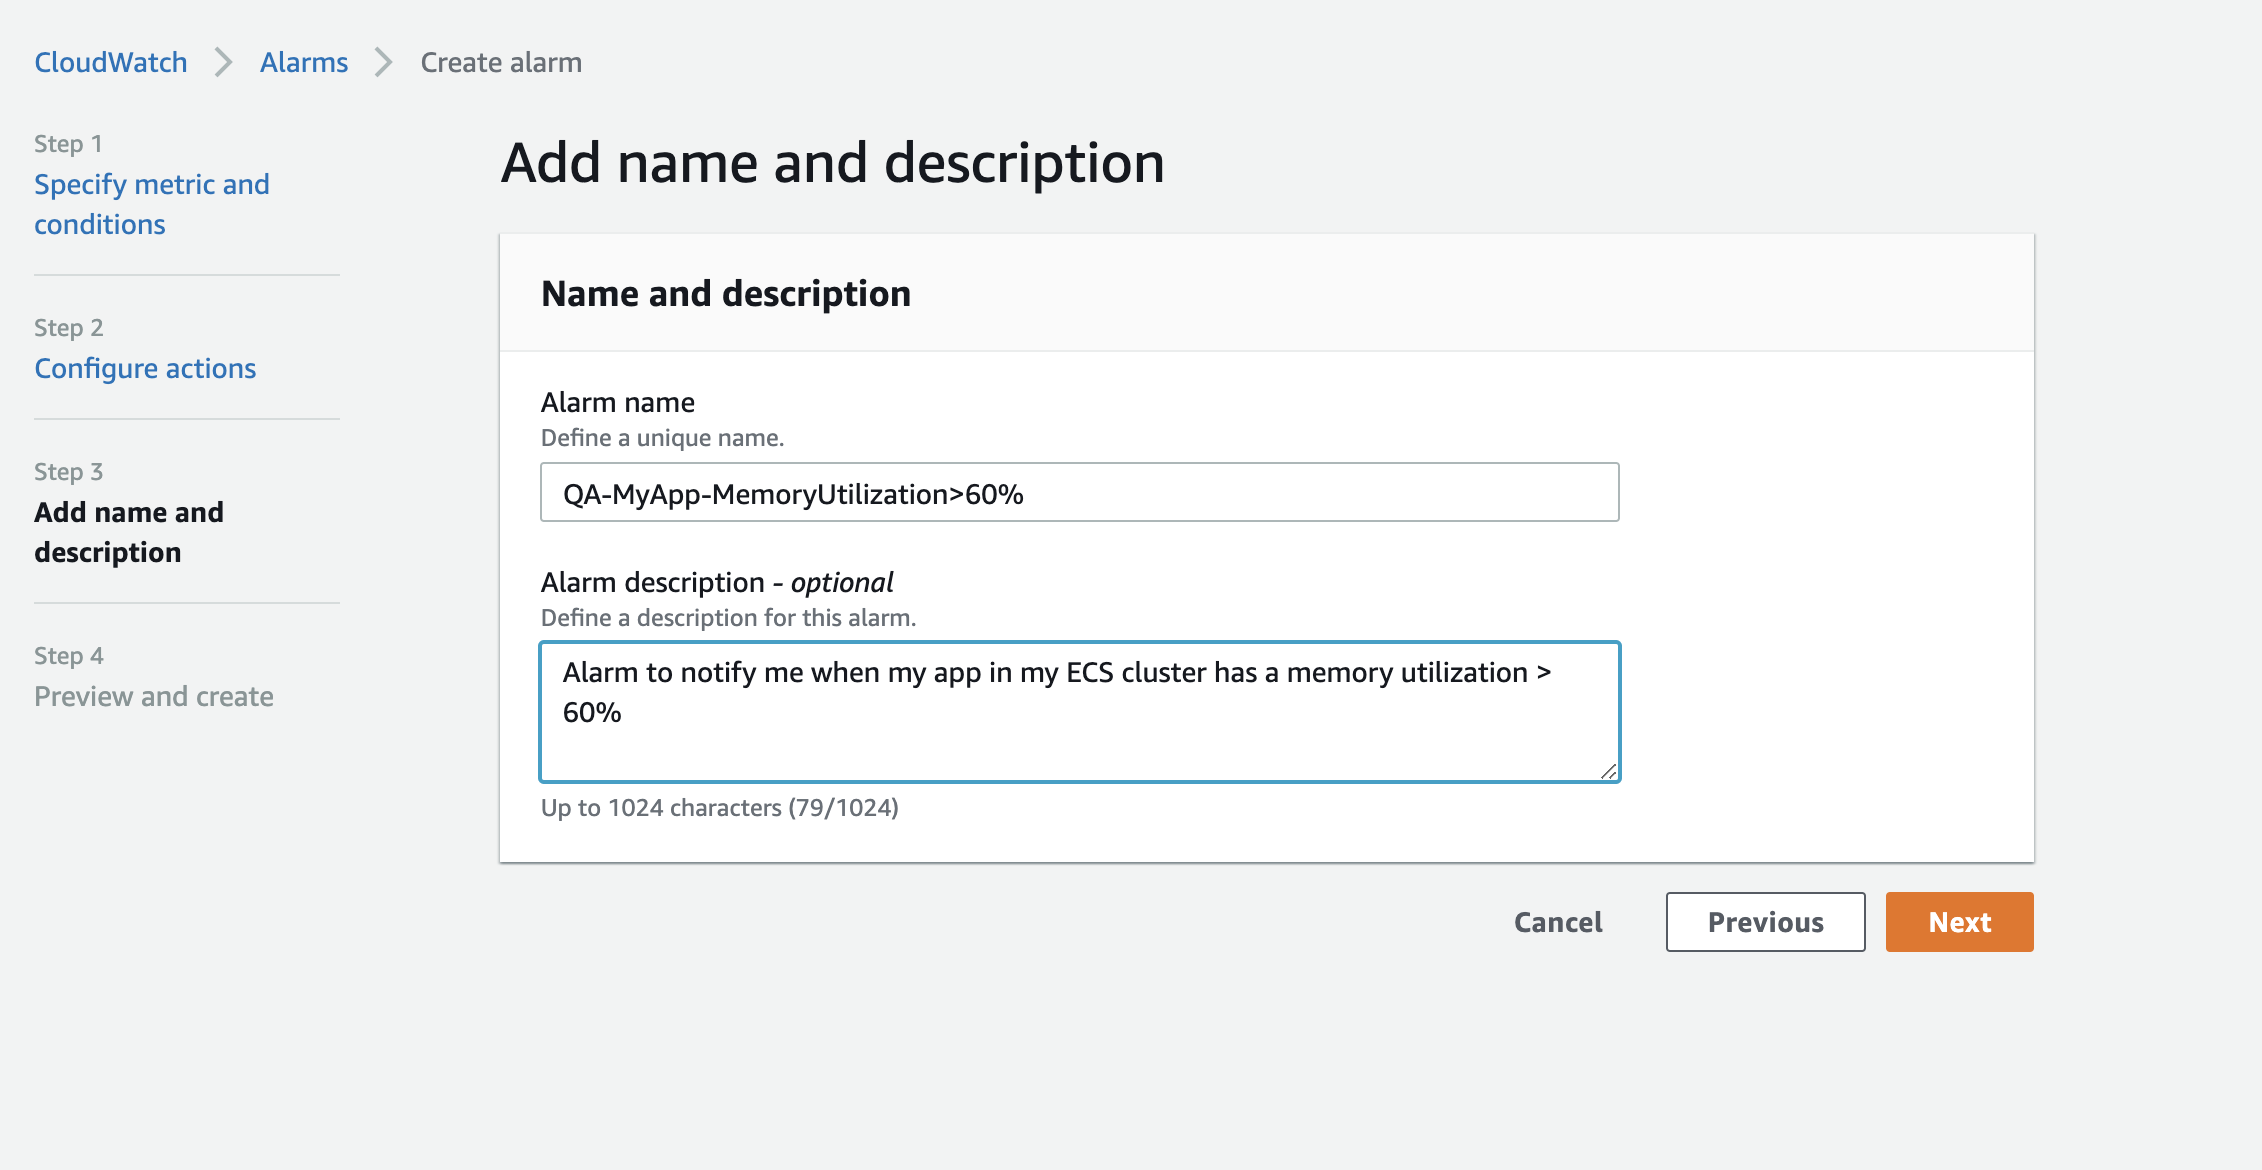
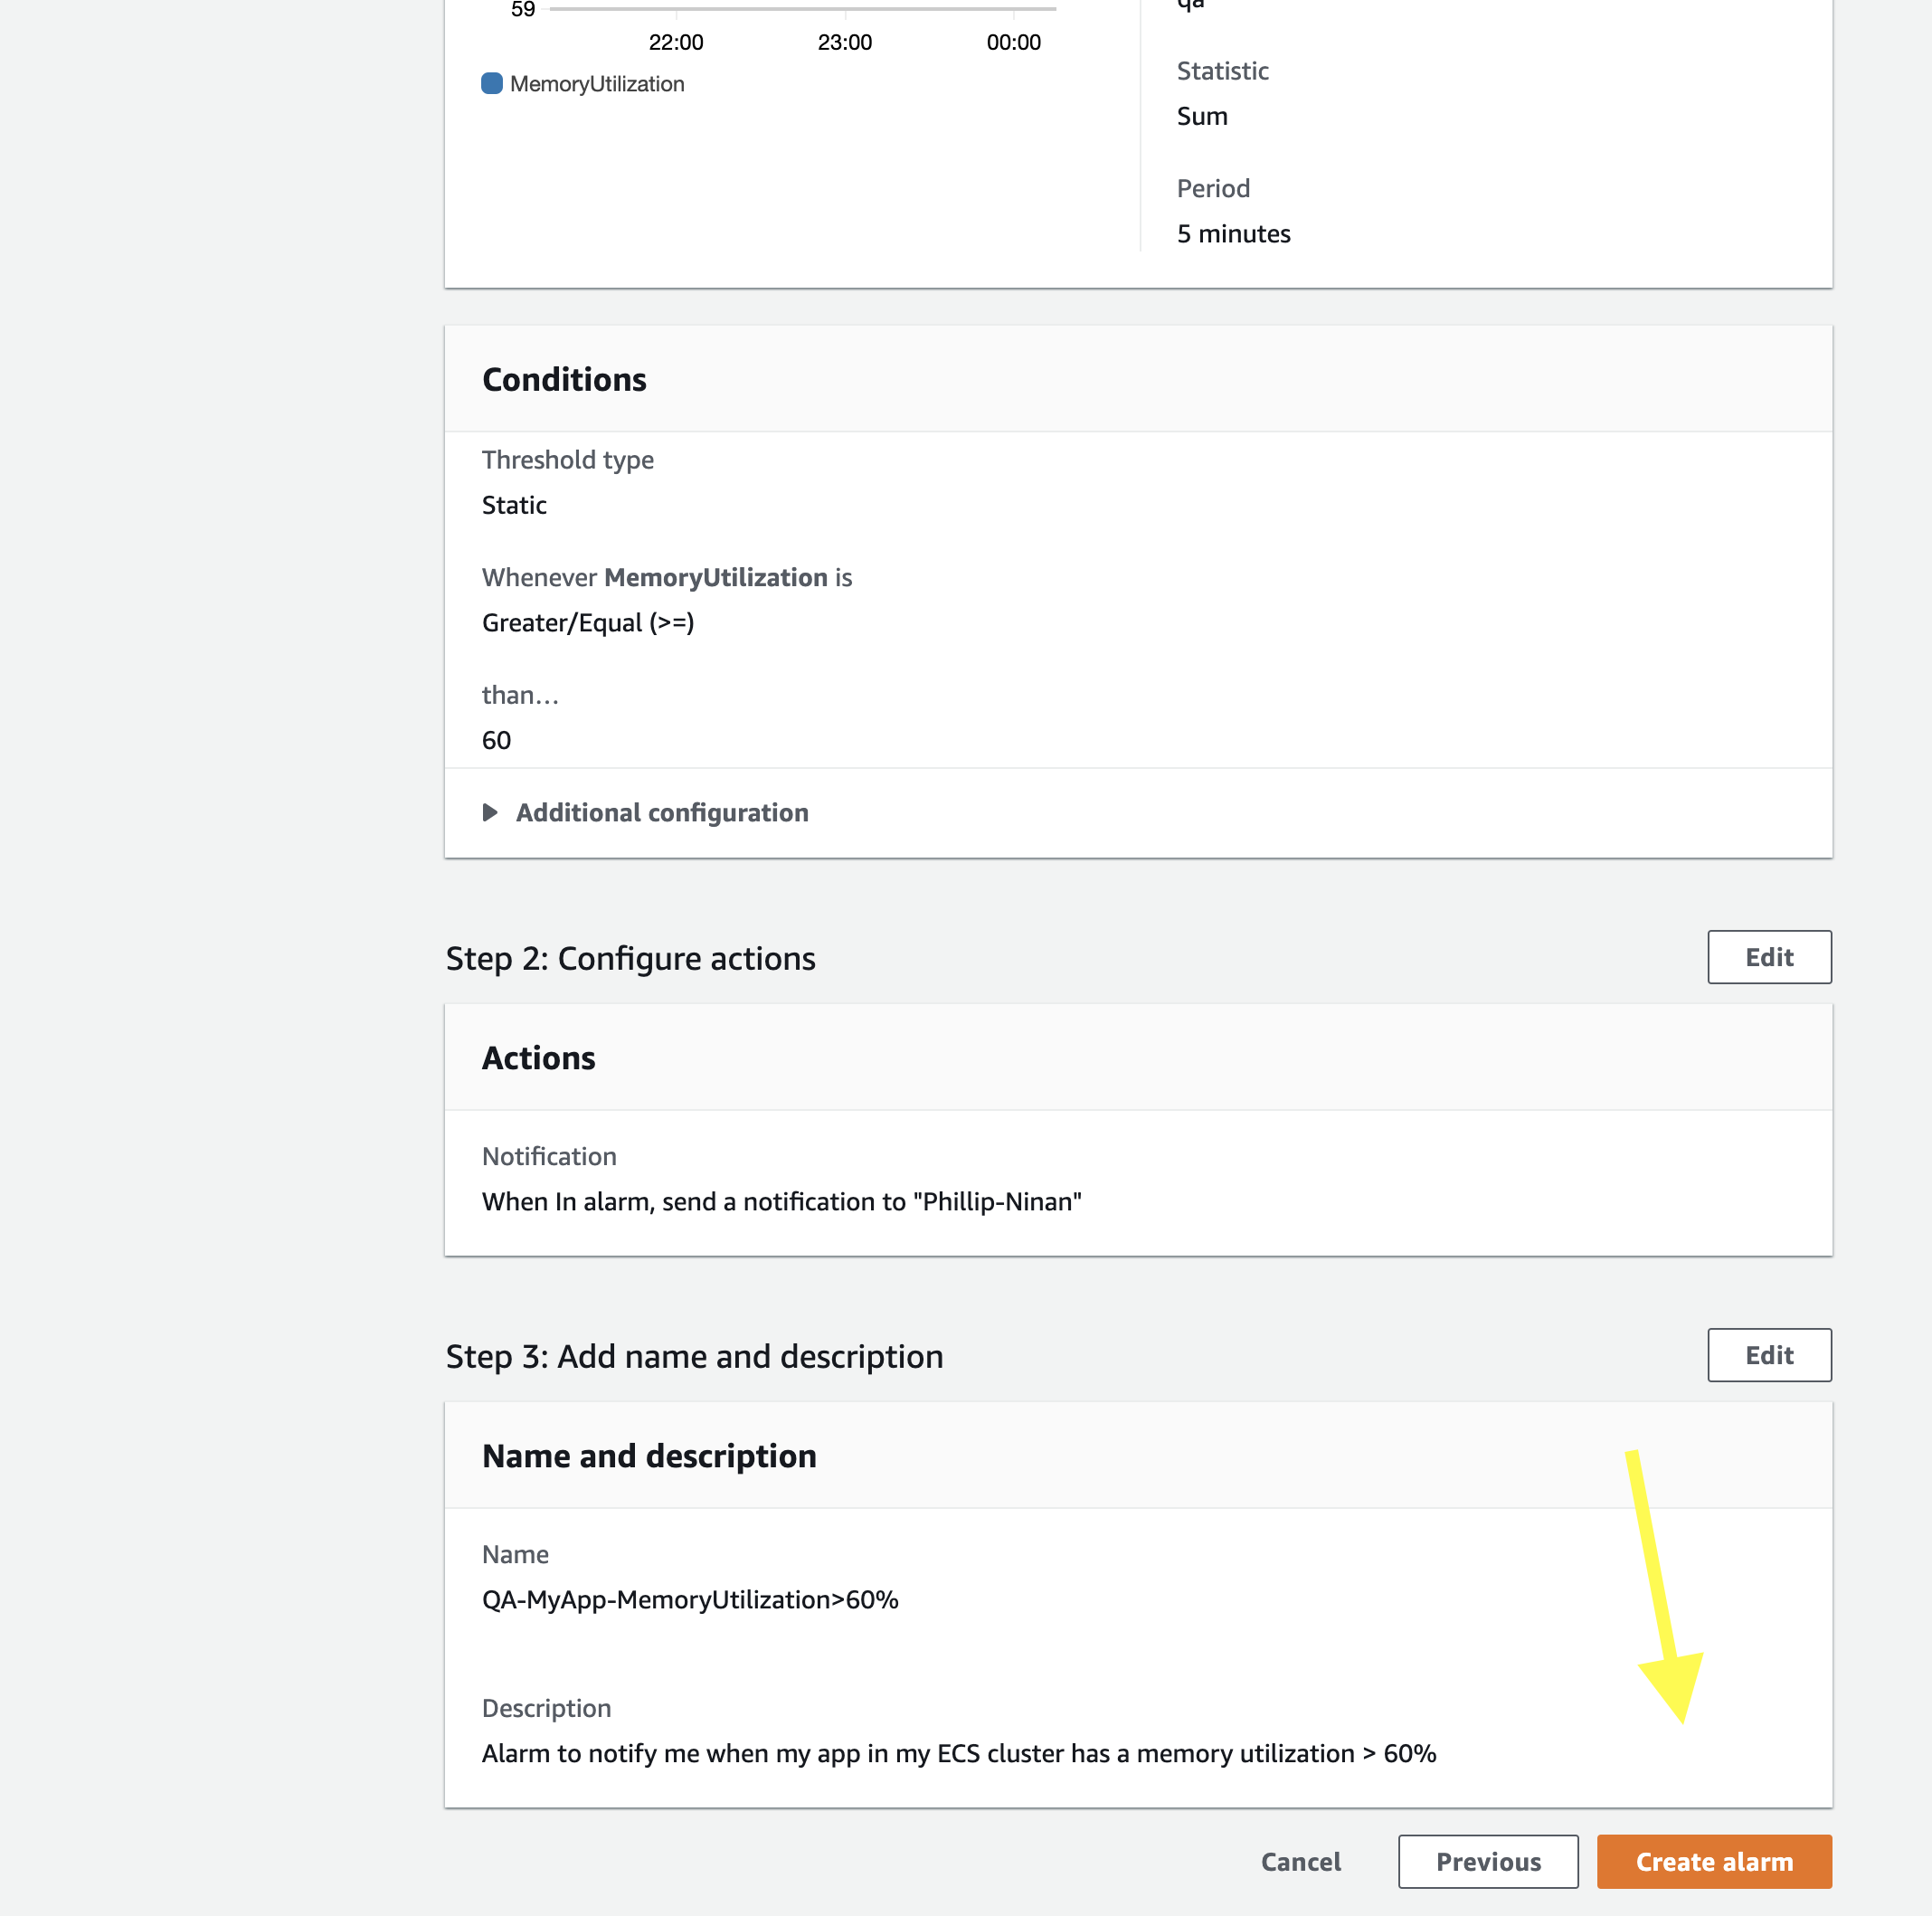
Finally hit create!
Next, I will show you how to create a dashboard so you can take a look for yourself without setting up an alarm! CloudWatch Dashboards are very useful to get metrics for a variety of metrics across different services all in one place. I personally create a dashboard for each environment for a client: develop, QA, UAT, staging, production, etc. You first need to navigate to CloudWatch in your AWS account.
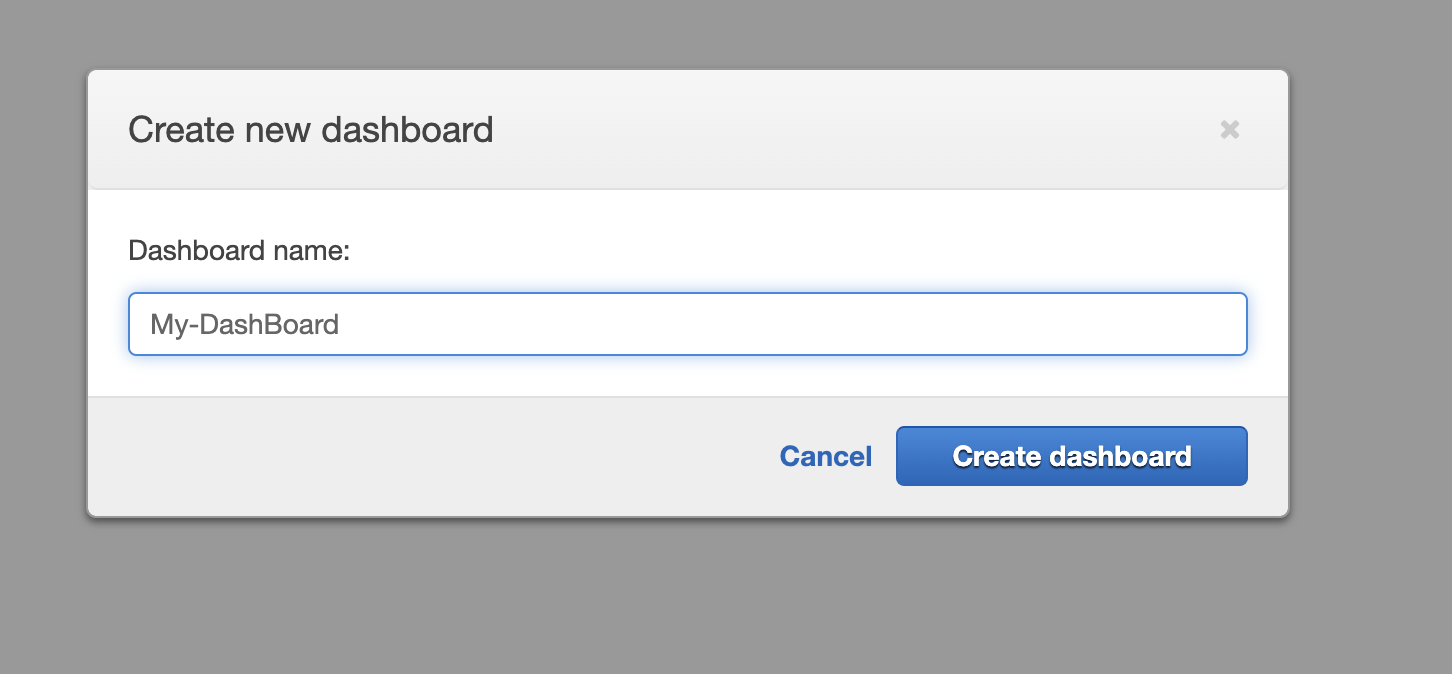
Navigate to the dashboard link in CloudWatch and create a description
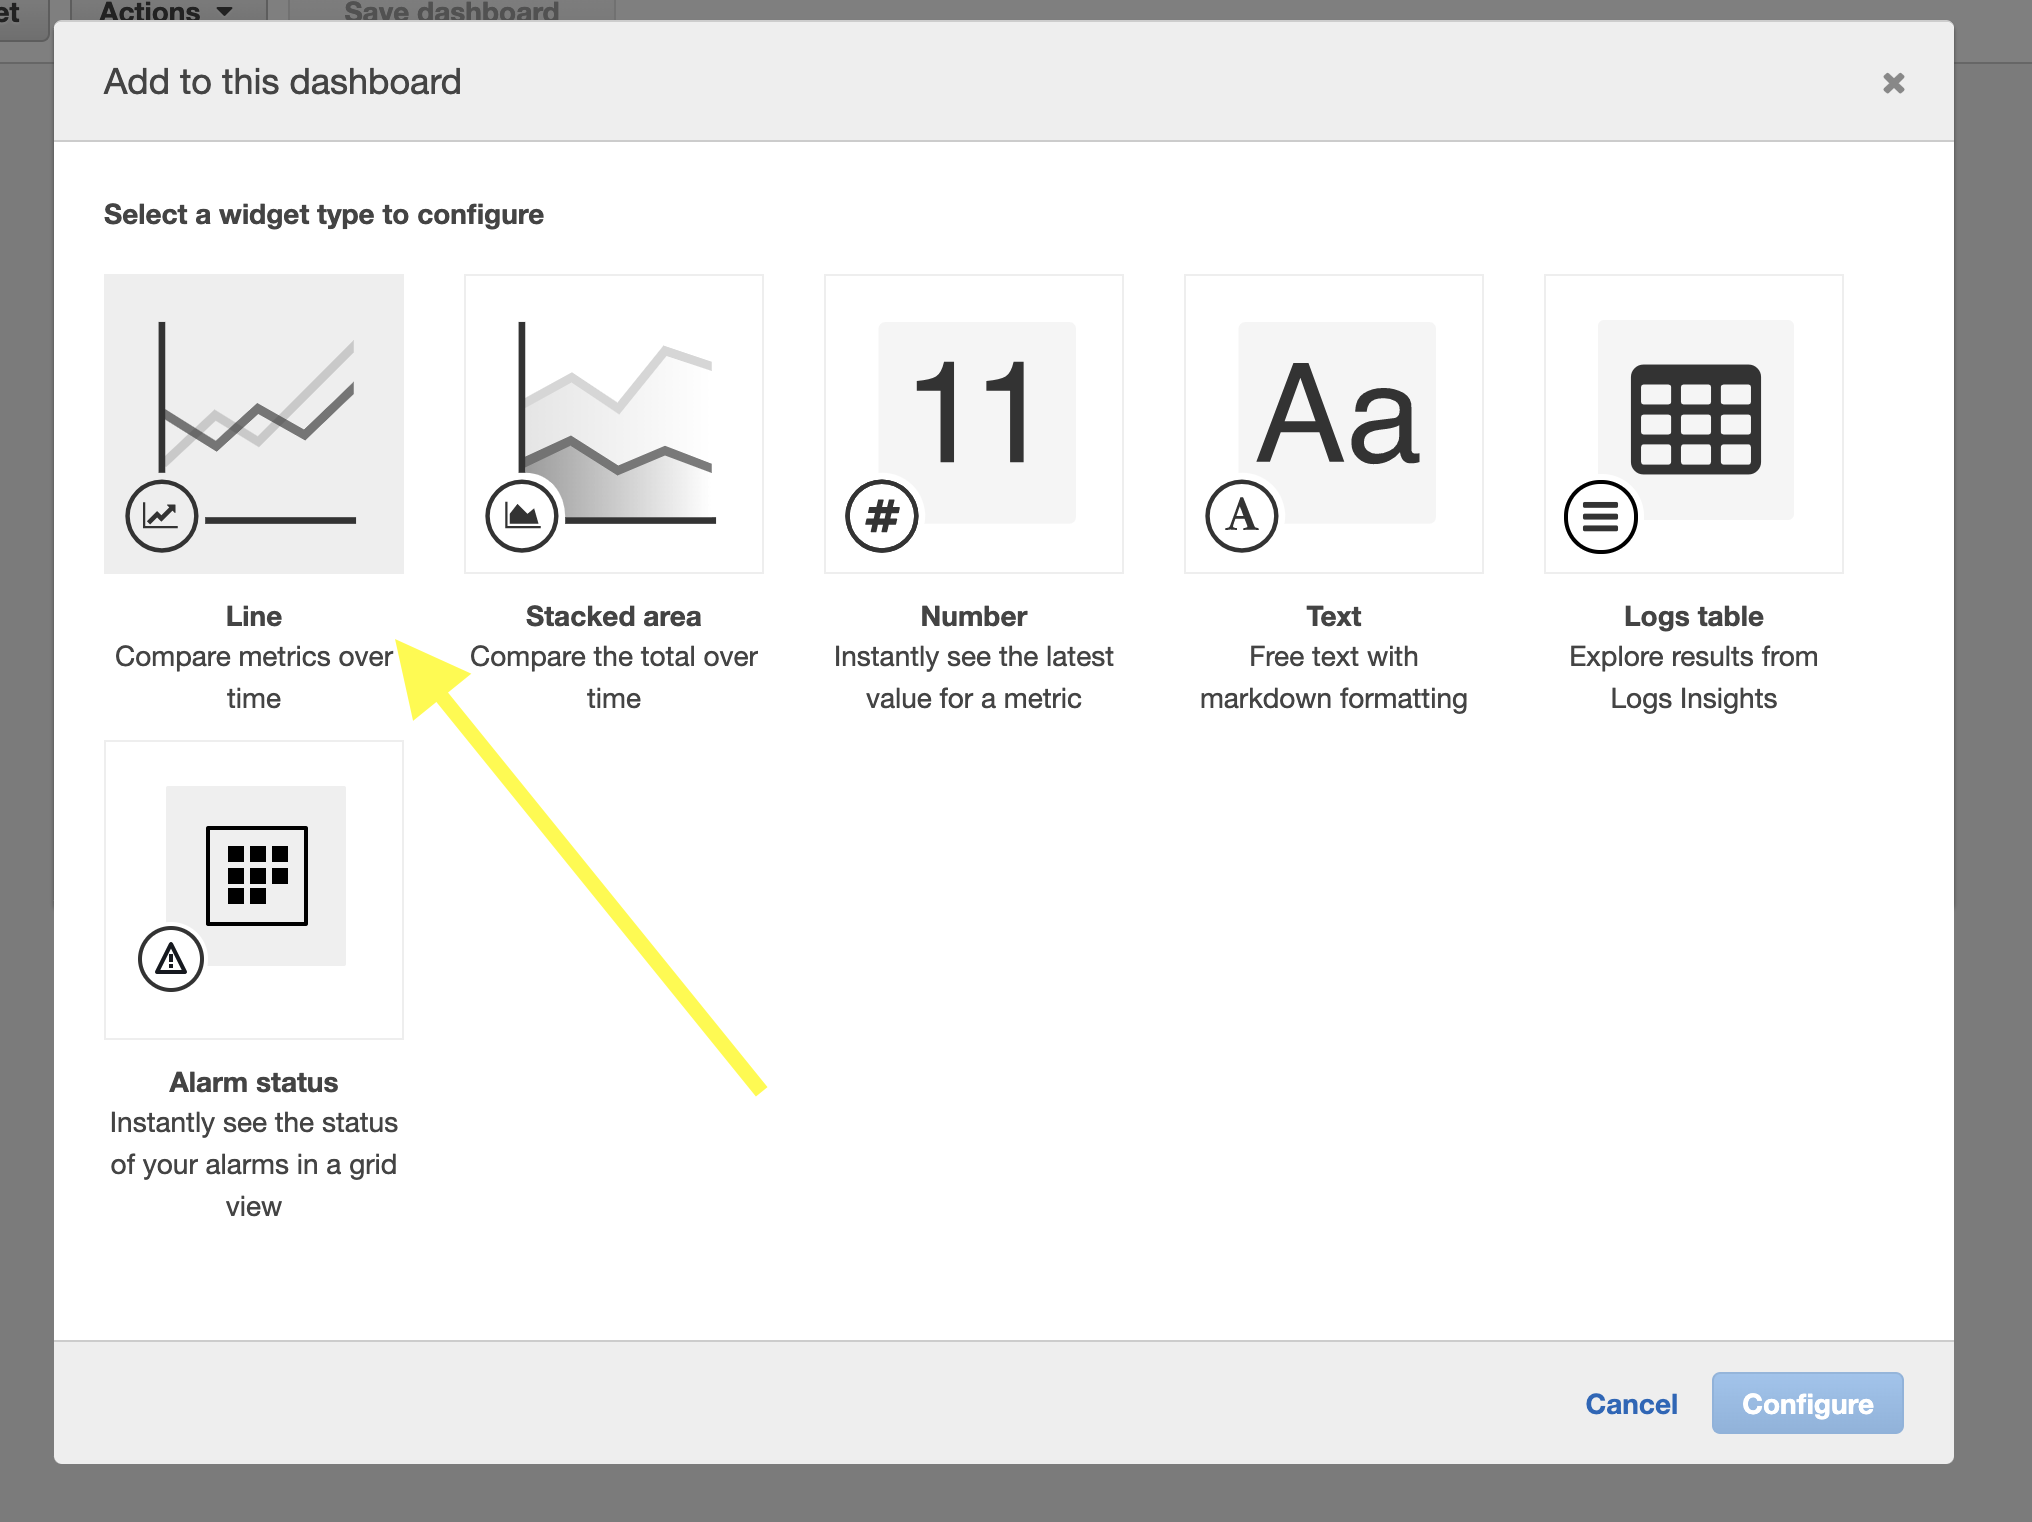
Select a type of graph
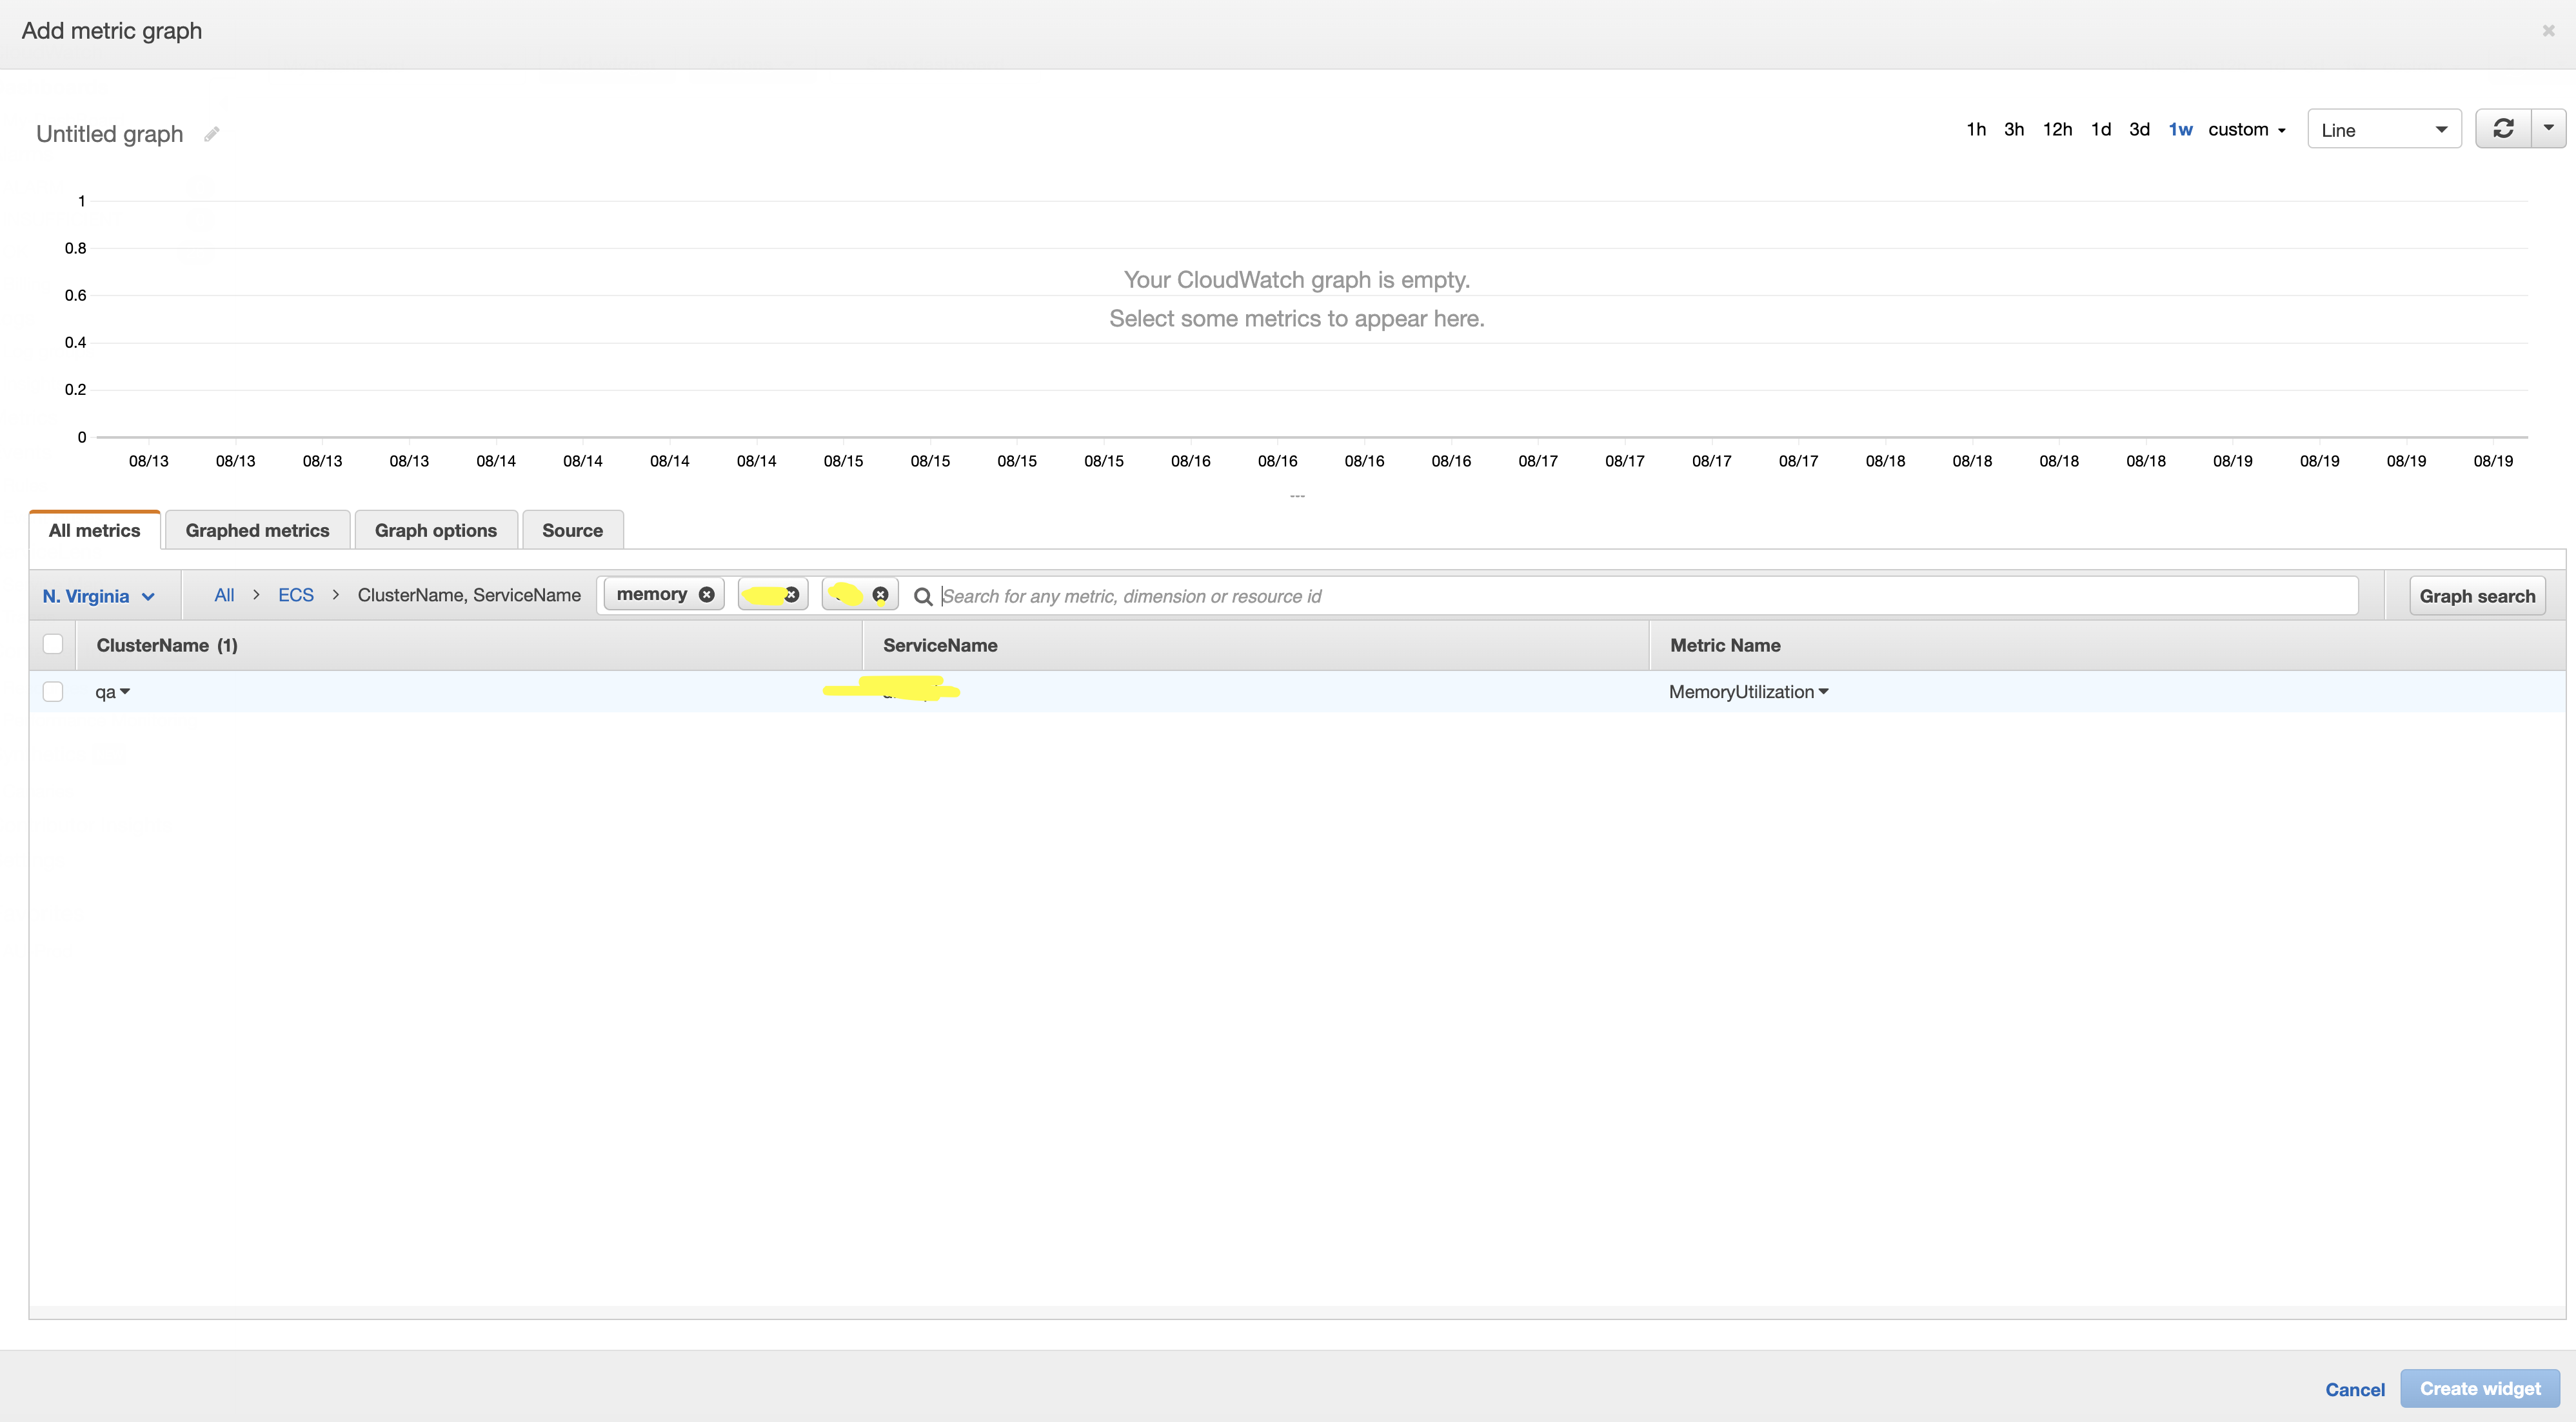
Select a metric. Here I am using MemoryUtilization, but CloudWatch has a huge set of metrics
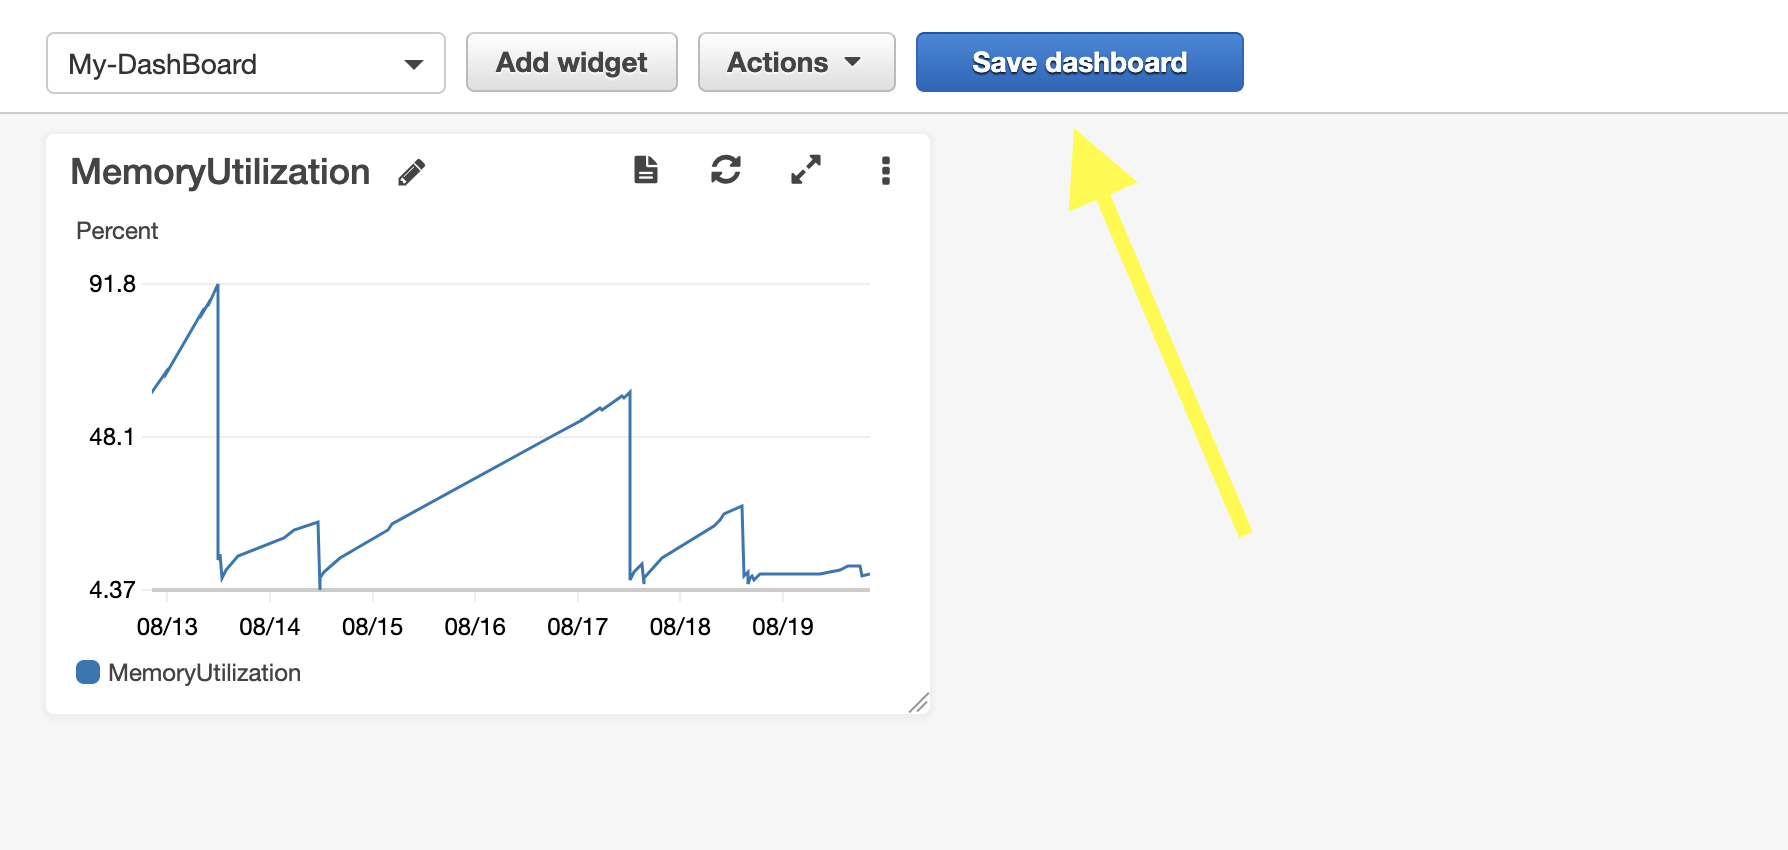
Finally save the Dashboard!
I hope you enjoyed this post! Next, I will be writing a post describing exactly how I fixed this memory leak. Tune in and make sure to read my post about how to profile a Spring Boot application using Visual VM.